A decade ago, the buzzword was “Big Data Revolution.” But, it seems that the story didn’t end with a fad. This very data wave has given birth to today’s tsunami called “Industrial Revolution 4.0”. The democratization of data has transformed the digital landscape entirely in just a few years. With this new beacon of light comes the need for several torchbearers who possess a deep understanding of new-age skill sets.
House of Bots predicts a 28% hike in demand for Data Scientists and Analytics, totaling 2,720,000 jobs in 2020. A 2017 report by the European Union Commission puts that number at 10.43 million.
While these numbers estimate in the millions, the staggering stats are in Data Science as a field itself. At the current pace, we are generating 2.5 quintillion bytes (that’s 2.5 X 1018 bytes) of data per day!
What Is the Definition of Data Science Today?
Simply put, Data Science is the study that converts data into value. Value of any form is market growth, sales, revenue, supply chain optimization, or even product development. Data Science uses statistical concepts and algorithms built on the ready availability of powerful computing to essentially solve the world’s problems. It gives us insights into the unknown and puts proven knowledge behind the backs of today’s decision-makers, be it a Project Manager at the ground level or a policy-maker in the Parliament House.
Data Science has penetrated all horizontals and verticals of the global market, i.e., there is no industry, and there is no department in an industry that doesn’t need a Data Scientist or Analyst today.

Several globally renowned market research organizations, including PwC, LinkedIn, Glassdoor, and Forbes, have named Data Science as the most coveted job title of the decade. But as they say, heavy is the head that wears the crown! The harsh reality of this sudden job surge is the incredible skills gap that has accompanied it.
If you want to become a pioneer data scientist, you would require coding skills and a firm grasp of statistical concepts. Whether you are a fresher or a seasoned professional, most interviewers would prefer to hire job seekers who are quickly able to answer both types of data science interview questions.
This list is a compilation of the most common interview questions on data science that test the overall skill set of applicants. That said, you can read this questionnaire to familiarize yourself with the concept as a learning path or even to simply test yourself before you hit the ‘Submit Application’ button.
Basic/General Data Science Interview Questions and Answers
The below data science interview questions explain to the interviewer how well you understand the role of a data scientist in an organization. It is also a test of your passion for the subject, and whether your foundation is strong.
1. What is Data Science? What is the goal of data science? Explain the difference between supervised and unsupervised learning.
Data is a multidisciplinary field that combines various tools, algorithms, statistics, and mathematical principles to derive meaningful insights from raw data. In essence, the goal of performing any data analysis is to find hidden patterns in data that uncover facts, based on which real-life decisions can be made.
Supervised Learning: Supervised learning is used to perform predictions rather than analyses. It requires the use of labeled input data. A training data set is required, over which a feedback mechanism is built. The most common supervised learning models include Logistic Regressions, Decision Trees, and Support Vector Machines.
Unsupervised Learning: On the other hand, unsupervised learning is used purely to perform analysis. It does not require labeled data, as there is no need for a feedback mechanism here. Commonly used unsupervised learning models include Anomaly Detection, Clustering, and Neural Networks.
You may like to read in more detail: What Is Data Science? Roles, Skills & Courses
2. What are univariate, bivariate, and multivariate analyses?
Univariate analysis is performed on a single variable, i.e., only one parameter describes the data. Some meaningful insights that can be derived from univariate data include: mean, median, mode, dispersion, minimum, maximum, etc.
An example of univariate data can be the height or weight of a population.
The bivariate analysis describes the relationship between two variables. The dependency between the two variables in the data set may be described in the form of cause and effect.
An example of bivariate analysis is the study of airplane ticket sales against the days of the week.
Multivariate analysis is performed on a data set with three or more variables/parameters. The mean, median, mode, etc., of each variable, can be used to derive further insights.
An example of multivariate analysis is the likelihood of contracting a disease based on age, comorbidities, habits and other factors.
3. What is linear regression? What are the assumptions required for carrying out linear regression?
Linear regression is a supervised learning algorithm that is used to predict the score of a variable, say Y (criterion variable), based on the score of another variable, say X (predictor variable). If there are many dependent variables, it is a simple linear regression. Many independent variables constitute a multiple linear regression.

Assumptions:
- The sample used to build the data model is representative of the population.
- The relation between predictor variable X and the mean of criterion variable Y is linear.
- Homoscedasticity
- For any value of X, Y is normally distributed.
- Observations are independent of each other.
You may also like to read: What is Linear Regression in Machine Learning?
4. Explain Logistic Regression from a layman perspective.
Logistic regression is the technique used to forecast the binary outcome from a linear combination of predictor variables. It is also commonly known as the logit model.
For example, predicting whether a sportsperson will win a match has a binary outcome. The predictor variables here would be the health of the player, time spent in training, etc.
In technical terms, logistic regression establishes the relationship between a dependent variable (binary outcome variable) against various independent variables (the health of a player, time spent in training, etc.).
You may also like to read: Logistic Regression in R – Explained with Simple Examples
5. Explain the Decision Tree in detail
A decision tree is a supervised learning algorithm used to solve regression and classification problems. It is commonly used in Operation Research, Planning, and ML.
A decision tree is used to predict the value of a target variable using simple decision rules that are based on data features.

In a decision tree, each node represents an attribute, each link represents a decision, and the leaves represent the outcome.
CART (Classification and Regression Tree) and ID3 (Iterative Dichotomiser 3) are commonly used algorithms to build decision trees.
The advantage of Decision Trees is that they mimic the human brain function well and are consequently easy to visualize and understand. But they do fall short in terms of accuracy.
6. What is a random forest? How do you work towards it?
A random forest combines several weak decision trees to form a powerful learning model. It is a form of ensemble learning and can be used for both classification and regression tasks.

To build a random forest, several decision trees are created, wherein each tree gives a classification to classify new objects based on an attribute. The forest chooses a tree using the “majority wins” rule, and the average of outputs by different trees is chosen as the target value prediction.
Random forests give feature importance and perform strongly naturally, requiring no cross-validation. They are also used to treat missing values and outlier values.
Note: The above data science interview questions can also be framed as “Which do you prefer, 50 small decision trees or one large tree?” Random forests are more accurate and less prone to overfitting than a single decision tree.
7. Explain the SVM algorithm
SVM stands for Support Vector Machine. This algorithm can be used for both regression and classification. Consider a training data set with n-features. SVM will plot the value of each feature against a coordinate, thereby forming an n-dimensional space. SVM builds a separating plane, known as a hyperplane, to distinguish between two classes of variables.
For more details, you may like to read: Introduction To SVM – Support Vector Machine Algorithm in Machine Learning
8. What are recommender systems?
Recommender systems attempt to predict the ratings or preferences of a user for a particular product. They are a class of information filtering systems. They can be of two types:
- Collaborative filtering: This system performs recommendations based on similarities in interests with other users. Eg. Amazon recommends products based on purchases of other users. Notice “Customers who bought this also bought… “
- Content-based filtering: Here, the recommendations are based on similarity in properties. For example, Pandora recommends songs based on artists and the genre of music you are listening to.
Note: This interview question on Data Science can also be framed as “What type of recommender system do you think Amazon/Spotify/Pandora/Last.fm etc. use?”
9. How regularly should you update an algorithm?
An algorithm must be updated when:
- It starts to show inaccuracy frequently or is underperforming.
- This could be because of the data source or the population in itself is changing.
- The model needs to evolve through changing infrastructure, data pipelines, business context, etc.
10. Deep learning, Machine Learning, Reinforced Learning – Can you explain each of them?

Machine Learning attempts to provide computers with the ability to learn without providing explicit instructions.
Deep Learning is a subset of ML that attempts to mimic the structure and functioning of the human brain through the development of artificial neural networks. Therefore, it is considered a subset of machine learning.
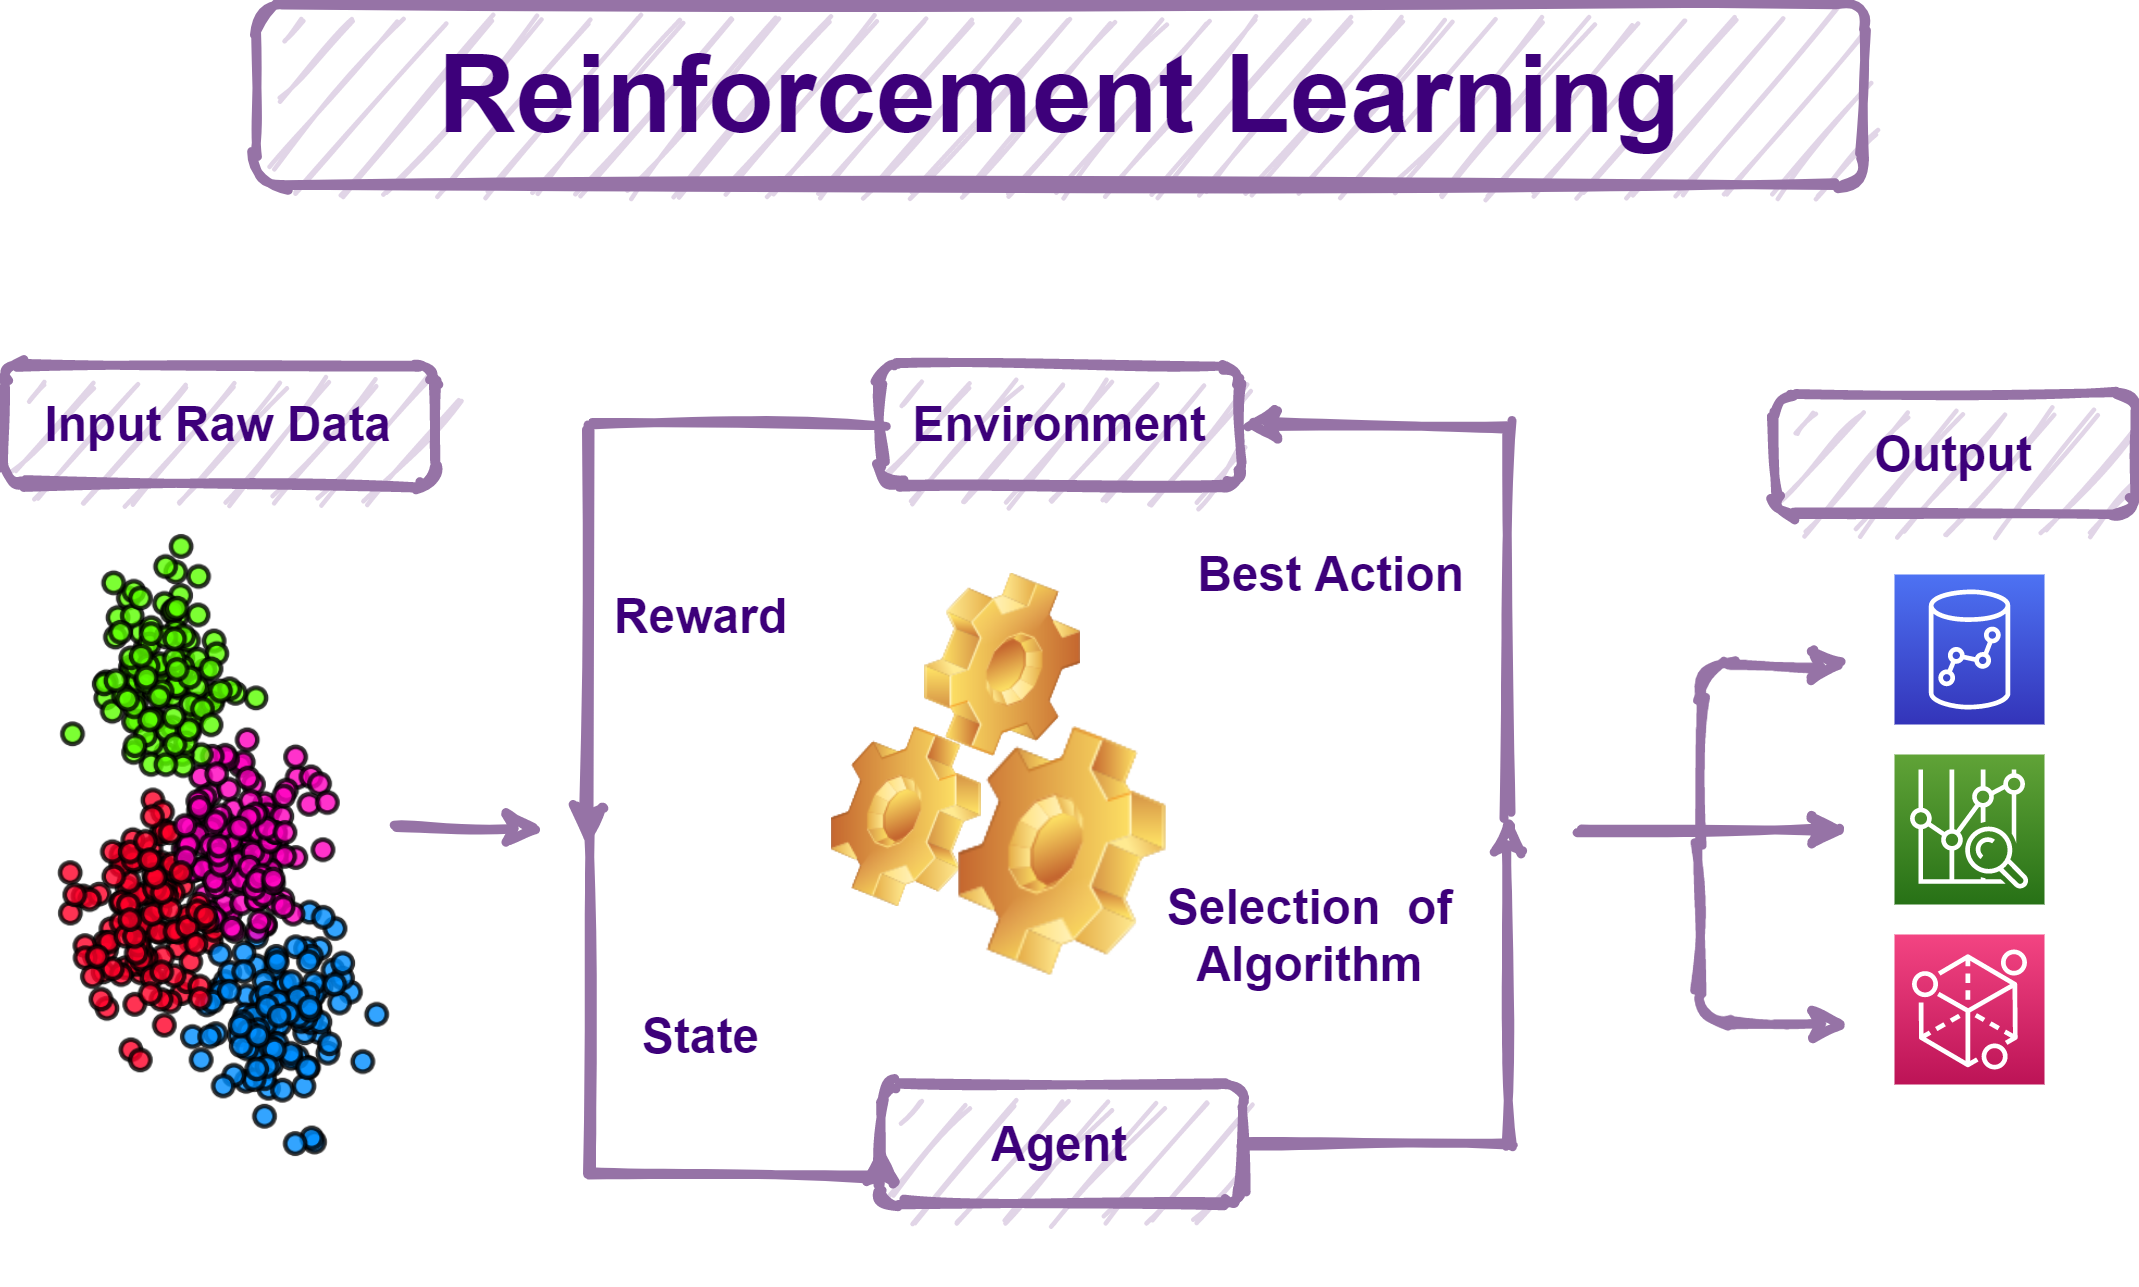
Reinforcement learning is based on the reward/penalty mechanism of the human mind. It maps situations to actions, and the end goal of the learner is to learn to take actions/decisions that maximize rewards.
Related: Data Science vs. Machine Learning vs. AI Deep Learning – What is the difference?
11. Python vs R? Where do you stand?
This choice depends on the application. It seems that Python is the preferred choice for R&D, maybe because of the wide range of libraries and packages that correspond to particular fields. On the other hand, Python is the go-to choice for industrialists and software developers as it is a complete package for product deployment, data analysis, and visualization. Python also enjoys wider community support and offers better tools for debugging and testing. This would be crucial in a fast-paced competitive market environment.
PS: It is interesting to note that while R is used in research, and Python is for enterprise, on average, Data Scientists who use R earn less than those who use Python.
Note: If you’re answering interview questions on data science for text analysis, particularly, Python is the clear choice due to the robust Pandas Library containing easy-to-use data structures and analysis tools. R beats Python in terms of text analytics libraries, especially for packages that handle unstructured data. But it fails to provide good data mining libraries. Python is also the winner in terms of its sheer ability to handle colossal amounts of data. However, R can be quite slow and does have some memory constraints.
Related: The Best Machine Learning Tools: Python vs R vs SAS
12. Do you follow any particular Data Science gurus, organizations, or startups? If so, what do you admire about them?
Note: While this interview question for data scientists may be personal, consider taking some cues and hints from the answer below. How you frame your answer to this question is important in assuring your interviewer of your passion for the project/ Data Science domain. For example, if you happen to speak about organizations or startups, a clever thing to do would be to research startups closely related to the field you’re interviewing for.
Sebastian Thrun, who is the founder of Google X, is a prolific data scientist with a mass following. His work is fascinating as he pushes the boundaries of the realm of data science, exploring far-off futuristic technologies.
Other commendable data scientists include Andrew Ng, Fei-fei Li, DJ Patil, Kirk Borne and Nando de Freitas.
You may also like to read: Top 25 Data Science Books – Learn Data Science
13. Suppose you have 4GB RAM but need to train a model on a 10GB data set, what would you do?
The key is to understand different types of ML techniques and their pros and cons. Some techniques can have a good fit even with lower samples, whereas you need a large sample for optimum performance in some cases. For example, for neural networks, batch size with NumPy can be undertaken. For SVM, a partial fit will suffice.
Some candidates propose to use a fee cloud platform for situations, like Google Codevwp. But more often than not, when you are faced with this question, the interviewer is expecting you to ask, “Which ML model needs to be trained?”
You may also like read: How to Choose The Best Algorithm for Your Applied AI & ML Solution
Python Interview Questions for Data Science
Python is a highly sought-after skill set and is pervasive in many sectors. Mastering Python interview questions for Data Science is an absolute must, be it whichever data analysis job profile you are applying for.
14. How handy are you with Python?
Important skill sets that are necessary for data analysis with Python include:
- Understanding of built-in data types like lists, dictionaries, and tuples.
- Mastery of NumPy arrays including the ability to perform element-wise and matrix-wise operations.
- Familiarity with Pandas
- Scikit-learn
- Ability to write small, clean, and pure code-bits or functions that don’t distort objects.
- Efficiency in scripting is a must. For example, choosing list comprehensions instead of traditional for-loops.
- Profiling performance and optimizing bottlenecks
Note: Be prepared to write code-bits on the go. Some examples are provided below.
Learn more about Data Types, Structures and Applications
15. What Python libraries are you familiar with?
Some important and widely used Python libraries for data science are:
- NumPy
- SciPy
- Keras
- Tensor-Flow
- Scikit-Learn
- Pandas
- Matplotlib
You may also like read: 50 Ultimate Python Data Science Libraries to Learn in 2021
16. What are Pickling and Unpickling?
Pickle module is used to serialize or deserialize an object. The process of converting Python objects to character streams/string representations and dumping them into a file using the dump function is known as pickling. Unpickling is the reverse process, where original Python objects are restored from a string representation.
17. What is a lambda function?
Lambda function is a single-line anonymous function. It can have many parameters but only one statement.
Example:
a = lambda x,y : x*y
print(a(5,5))
Output: 25
18. What are negative indexes? When are they used?
Sequences in Python are indexed and consist of both positive and negative numbers.
Positive indexing uses ‘0’ as the first index, ‘1’ as the second index, and so on.
Negative indexing uses ‘-1’ as the last index, ‘-2’ as the penultimate index and so on.
If the code becomes simpler and more efficient by accessing array or list items from the end rather than the beginning, use negative indexing.
19. Why use NumPy arrays instead of nested Python lists?
Python lists are efficient while performing basic data manipulations like insert, delete, append and concatenate. However, they fall short when vector operations like element-wise operations are to be carried out.
NumPy simplifies all matrix operations, allowing you to shorten code and avoid unnecessary repetitive code-blocks. You can perform FFTs, convolutions, searching, statistics operations, linear algebra, and much more using NumPy functions.
20. How is memory managed in Python?
Python uses private heap space to manage memory. The programmer is not allowed to access the heap, as the interpreter handles it. The core API enables access to Python tools for coding. The memory manager allocates heap space for objects and data structures, while the garbage collector recycles the memory that isn’t being used, thereby boosting heap space.

21. Does memory get deallocated when Python exits?
Python has an inbuilt garbage collector, an efficient clean-up mechanism that routinely boosts heap space by de-allocating/destroying objects. But not all spaces are freed. For example, modules having circular references or global references can’t be de-allocated. It is also not possible to de-allocate portions of memory that are reversed by the C library.
22. Compare NumPy and SciPy.
Both NumPy and SciPy are Python packages. NumPy stands for Numerical Python and SciPy for Scientific Python. As the name suggests, NumPy aims to offer functions to perform operations on homogenous. For example, it could be basic operations like sorting, indexing and other elementary functions that are needed to be carried out on array data type. On the other hand, SciPy is a collection of tools that support commonly used scientific operations like integration, differentiation, algebraic functions, and so on. Some functions that were originally only in SciPy have now been added to NumPy, citing compatibility as the reason. Although there is a lot of debate in the data science community as to which module to use, most often, both modules are used together to obtain the final objective.
23. Differentiate between lists and tuples
- Lists are ordered sequences, typically of the same type of object.
- Tuples are structures, and different data types can be defined for each index.
- Lists are mutable while tuples are immutable.
Note: This is one of the most commonly asked data science questions at job interviews.
24. List1 = [1, 2, 3, 4]
List2 = [5, 6, 7, 8]
print(len(list1 + list2)). What is the output?
The correct answer is 8. ‘+’ function concatenates/appends two lists.
25. Optimize the below code:
word = ‘Hello’
print word._len_()
Answer: print ‘Hello’._len_()
26. What is a map function in Python?
Map function allows you to apply a specific function to every element in a sequence.
Example:
def add_three (x) :
return x + 5
li = [1, 2, 3]
list(map(add_three, li))
# => [6, 7, 8]
27. Explain the difference between shallow copy and deep copy
li1 = [[‘a’], [‘b’], [‘c’]]
Consider three instances in the context of a mutable object:
- Li2 = li1
This creates a reference. Li2 is simply a new name that points to li1. Any change in li1 is reflected in li2.
- li2 = list(li1)
This creates a shallow copy – a new object that contains elemental references to the original. Here, appending li1 does not reflect on li2. But modifying li1 will reflect on li2.
- li2 = copy.deepcopy(li1)
The deepcopy function creates an entirely new object. No changes in li1 are reflected in li2.
28. Which NumPy function will you use to calculate the Euclidean distance between two arrays?
The linalg.norm() function is used to calculate the Euclidean distance between two arrays.
Example:
x = np.array([1, 2, 3, 4, 5])
y = np.array([6, 7, 8, 9, 10])
#Solution
e_dist = np.linalg.norm(x-y)
e_dist
11.180339887498949
You may also like to read: Top 50 Python Interview Questions for Data Science
Statistics Interview Questions
Most interviews will have a take-home/in-person assignment round where your coding skills will be tested in practicum. Therefore, oral data science interview questions are often full of statistics concepts and definitions. Be sure to get through with this section. Planning how you will answer these questions face-to-face (with your good old friend a mirror) can help boost your confidence.
If you are a beginner it will also be beneficial to go through Fundamentals of Statistics for Data Science.
29. Can you explain Normal Distribution?
A normal distribution is a symmetric distribution that describes the values of a variable that are distributed. Most data points cluster around a central peak, and the probabilities of values farther away from the peak taper off equally in either direction. It is also known as the bell curve. It is important in statistics as several natural phenomena like height, IQ, and BP bear a resemblance to this distribution. In a normal distribution, the mean, median, and mode are all located in the center.

30. Can you explain the importance of the Central Limit Theorem?
The Central Limit Theorem states that the normalized sum of individual variables tends towards a normal distribution, even if the original variables aren’t normally distributed.
This theorem is used in hypothesis testing and for calculating confidence intervals.
Related: Application of Central Limit Theorem in Supply Chain: An Illustration
31. What is so Naive about the Naive Bayes Theorem?
Bayes Theorem describes the probability of an event based on prior knowledge of conditions that may be related to the event. The naivety stems from the assumption of conditional independence between every pair of features.
32. Explain correlation and covariance.
Correlation and covariance serve the same purpose – to measure the dependency between two variables.
Correlation quantitatively estimates how strongly two variables are related to each other.
Covariance determines the extent to which two variables change within a cycle. It measures the strength of systemic relation, where changes in one variable cause a corresponding reciprocal change in another variable.
33. What is A/B testing?
A/B testing is a form of hypothesis testing. Commonly used to improve and optimize user experience in marketing, it is a randomized test that compares two versions of the same variable, control, and a variant.

Suppose there are two versions of a pop-up notification that asks users of a website for their email, say a blue one and a yellow one. A/B testing can be used to find out which version is more successful in collecting e-mail IDs of visitors.
34. What is a type I and type II error?
A type I error occurs when a null hypothesis is true but is rejected. A type II error occurs when a null hypothesis is false but is accepted.

35. What is a p-value?
P-values are a measure of the strength of the results of a hypothesis test. It is denoted as a number between 0 and 1.

If want confidence interval of 95%, Null-hypothesis is rejected if p ≤ 0.05. Null-hypothesis is accepted if p ≥ 0.05.
36. What is sensitivity/ recall? How do you calculate it?
Sensitivity is a measure that validates the accuracy of your data model/classifier (Logistic, SVM, Random Forest etc.)
Sensitivity is calculated as “Predicted true events/Total events.”
 Image Source: towardsdatascience.com
37. What is specificity?
Specificity is the ratio of true negatives to actual negatives as explain in the above illustration.
38. What is the law of large numbers?
The law of large numbers states that as the sample size increases, the mean gets closer to the average of a population.
39. Explain under-fitting and overfitting
In all supervised learning algorithms, the common task is to fit a model to training data, which is then used to make reliable predictions and build a feedback mechanism with the actual data set.

On the other hand, an under-fitted model fails to capture the trend in the training data. For example, Underfitting can occur when a linear model is used to fit non-linear data. Basically, a model that is too simple to capture the complex patterns in the data.
An excessively complex model and has too many parameters relative to the number of observations is overfitted. An overfitted model tends to create random error or noise during predictions, as it would overreact to minor fluctuations in the training data. In a way, this can also be understood as a model memorizing the data rather than capturing the patterns.
A balanced model would have sufficient sophistication to capture the pattern and not get react to the noise in the data.
40. What is a bias-variance trade-off?
Bias: An error introduced in the algorithm due to oversimplification is known as bias. It leads to underfitting.
Low-bias machine learning algorithms include k-NN, SVM, and Decision Trees. High-bias models are linear and logistic regressions.
Variance: An error introduced by overcomplicating the ML algorithm is known as a variance. Your model is likely to overfit and will learn to detect and amplify noise.
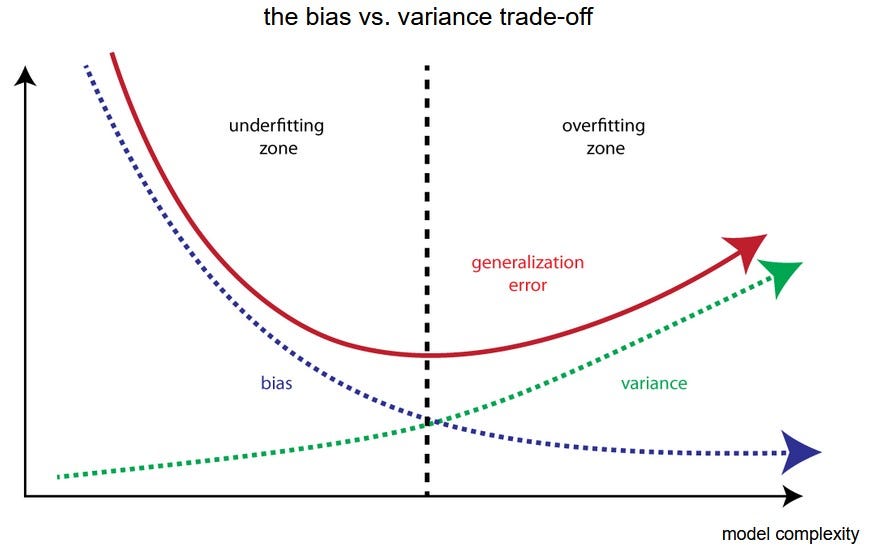
Bias and variance are inherently complementary, and there is no escaping this phenomenon. Therefore, a “trade-off” between the two parameters is simply the best outcome scenario. An ML algorithm that has both low-variance and low bias performs exceptionally well.
41. How can you combat overfitting and underfitting?
There are multiple ways to combat underfitting and overfitting:
- Resample the data and estimate model accuracy.
- Use a validation set to evaluate the model.
- Regularization is a commonly used method to reduce overfitting. In this method, a tuning parameter is added to induce smoothness.
For more details on Q39-Q41, please read: What Is Regularization in Machine Learning? Techniques & Methods
42. What type of biases can occur during sampling?
- Selection bias: It occurs when the sample obtained is not an accurate representation of the population.
- Undercoverage bias: It occurs when some members of the population are not adequately represented in the sample.
- Survivorship bias: It is a logical error that can occur when a selection process is employed during sampling. Overlooking members of the potential samples who did not pass the sample test, likely due to lower visibility, can lead to false predictions.
43. Explain selection bias in detail.
When the selection of samples isn’t thoroughly randomized, it leads to selection bias. It is the distortion of the sample data set by tweaking the method of sample collection. Types of selection bias include:
- Sampling bias: Here, some members of the populace are ignored, causing them to be underrepresented.
- Time interval: If the trial is terminated early simply because existent results support the hypothesis/prediction.
- Data: When specific participants in a sample are accepted or rejected based on arbitrary grounds, it seems to suit the needs of the analyzer.
- Attrition: Attrition bias occurs due to a loss of participants. This is a serious problem during clinical trials, where several participants get excluded as they do not follow the set procedure of a trial (like taking the wrong dose of medicine, skipping doses, taking medicines at the wrong time, indulging in alcohol/drugs that may interfere with the functioning of the medicine etc.)
44. Why is re-sampling undertaken?
- To estimate the accuracy of the existing sample data.
- Substituting labels when significance tests are performed.
- Validating models using random subsets, such as in the case of bootstrapping and cross-validation.
- To treat class imbalance in case classification models
45. What is a confusion matrix?
The four possible outcomes of a binary classifier are:
- True-Positive (TP) – Correct positive prediction
- False-Positive (FP) – Incorrect positive prediction
- True-Negative (TP) – Correct negative prediction
- False-negative (FP) – Incorrect negative prediction
A confusion matrix is a 2X2 table that contains all the four possible outcomes of a binary classifier.

A confusion matrix is helpful in quickly figuring out all the measures that evaluate the strength of a model, such as error rate, accuracy, sensitivity, specificity, precision, F-Score, etc.
46. Do you build your model to have lesser false positives or lesser false negatives?
(Trick data science question!) It depends on what is to be predicted.
For example, assume that you are to predict the necessity for chemotherapy in cancer patients. If a person has tested positive for cancerous tumors but doesn’t actually have cancer, it is a false positive case. In this scenario, if chemotherapy proceeds on a non-cancerous person, it may actually induce cancer in him! Here, reducing false positives is more important than false negatives.
On the other hand, take the case of scanning for wanted criminals at the airport. If a high-security alert is flagged during a staff shortage, it will be much easier for the criminal to be flagged as a non-threat. Here, detecting false negatives is more crucial.
Lastly, there are some cases where a bias on either side may be equally disastrous. For example, bankers who give out loans determine credibility using credit scores. If the credit score can’t detect false negatives, the bank will lose out on good customers. If the credit score can’t detect false positives, the bank will acquire bad customers.
47. How do you treat outliers?
If outliers are few, they can be assessed individually. If there are too many outliers, they can be replaced with 95th/99th or 5th/1st percentile values. Another approach is using mean +/- standard deviation based on the data distribution.
Most often, outlier values are just changed to bring to the range or just removed.
48. When would you use median over mean?
A median is used when the number of outliers is so large that it skews the data. Another case is when you are dealing with ordinal data, but for some reason, treating it as continuous numerical data.
49. How do you treat missing values?
Many times, detecting patterns in missing values themselves can lead to potentially beneficial insights.
If there is no pattern, they can be replaced with a mean value, median value or simply be ignored. For missing data in categorical variables, a default value is assigned. Sometimes you may need to drop the variable altogether if there are too many missing values.
50. Consider a derby of 5 lanes, where 25 horses are competing for the title. How many races need to be held to determine the fastest 3?
Since there are five lanes, the horses are divided into five groups (A, B, C, D, and E). The fastest in each group is determined first, i.e., five races determine five winners. A race between the five winners determines the fastest horse (say the winner is from group A). A race of 2nd place titleholder in group A and 1st place titleholder in groups B, C, D, and E, determines the second fastest horse. A race of 3rd place titleholder in group A and 2nd place titleholder in groups B, C, D and E, determines the third-fastest horse.
Learn from AnalytixLabs
You can also enroll in our online learning module for data science and our exclusive PG in data science certification courses course at your convenience, or you can book a demo with us.
Tips to Crack the Interview Questions for Data Scientists
The data scientist training doesn’t end with just acing the interview questions. There is a lot of background preparation to cracking the rounds that have to do with preparation for uncanny and high-order thinking skills questions. Here are a few things you can do to prepare yourself well before you enter the battlefield:
Build a good resume/portfolio:
Although it is often overlooked, building a professional resume that includes all your data-science-related achievements is necessary if you want to sail through screening. If you are unable to get through to the interview questions for the Data Scientists round, your resume is likely the issue. If you have attended hackathons, boot camps, or taken up certifications, highlight them. Make sure you include details about any projects you have undertaken. If you have participated in open-source projects, then make that your headliner under the achievements section! A one-page resume that links to an extensive LinkedIn/GitHub/Kaggle profile is the key to cutting through the mesh.
Gain practical experience:
Even if you are a fresher, you can get hands-on experience with building and training models, thanks to cloud computing. Google Cloud and AWS allow you to quickly set up environments and get cracking at code. Data scientist interview questions often include “What is your favorite algorithm?”Using cloud space will help you give a legitimate answer to that question!
Related: Top 20 (Interesting) Data Science Projects Ideas With Data
Prepare for the personal questions
Most interview questions for the role of a data scientist don’t start with data science, but with the aspiring data scientist in question, aka “Tell us about yourself.” Awkward silences and expressions often indicate low confidence or under-preparedness to the interviewer. So, prepare an answer and practice how you would say it in such a way that it doesn’t sound prepared. Showing openness and enthusiasm is always a great plus, but don’t sell yourself short!
Learn from your mistakes
The last and most important part is to just enjoy the process. Data Science is a nascent field with immense scope. As mentioned earlier, the demand for passionate people like you is quite high – meaning they NEED you! So, relax if you don’t crack it in the first go, it will happen eventually. Just like your algorithms, learn from previous experiences and better yourself each time. If you find that something is missing or wrong, upskill yourself just like you would update your algorithms! You’ll eventually get there.
Best of luck and happy job hunting!
You may also like to read:
1. Top 75 Natural Language Processing (NLP) Interview Questions
2. Top 60 Artificial Intelligence Interview Questions & Answers