Statistics is very crucial to data science. It helps in understanding data and the differences between different data samples. Statistics help perforfm predictive analytics and are classified into descriptive and inferential statistics. When dealing with data, it is essential to know about the types of distribution in statistics because, in theory, descriptive statistics help describe the data using different measures, and inferential statistics help perform various statistical tests for multiple analytical operations.
Also read: Descriptive vs. Inferential Statistics
In this article, you will learn about distribution, its types, importance, relationship with each other, etc. However, to learn about statistical distribution types and the very role that distribution plays in statistics and data science, you need to start with understanding data.
You must start with understanding data because the nature of data determines the type of distribution that will come into play, through which probabilities can be determined.
What is Data?
Data can be different for different fields.
In data science, a field that’s an amalgamation of multiple disciplines like computing, mathematics, statistics, etc., data refers to information that is available in a binary form allowing it to be stored, moved, and processed.
A common term in data science is ‘raw data’, which refers to unprocessed data often available in its most basic digital format and is often unstructured.
For a data scientist,
Data refers to any data that offers valuable insights via data mining, can be cleaned and fed into a predictive model to make futuristic predictions.
The rapid availability of data has led to many data storage, management, processing, and streaming tools and the development of new data professionals such as database administrators, big data engineers, etc.
How to understand data?
Different types of data hold different statistical properties and can have different distributions. However, to understand all that, you first need to understand the various shapes and forms in which data is found.
- Data can be understood in terms of its structure and type.
Structure refers to how data is stored and often depends on the tool you use to process it. Data can be one or two-dimensional (or can be in the form of containers), homogeneous, or heterogeneous (i.e., holding data of the same and varied data types).
Also read: Understanding Data Structures: Types and Applications
Examples of data structures include tuples, arrays, lists, dictionaries, dataframe, tables, nested lists, etc.
Data type is a universal aspect of data , which we will look into next.
Types of Data
A term common in data science and computer science is the data type, which refers to the nature of values in the data. This includes data types such as characters, integers, float, boolean, date, time, etc.
Going forward in the article: When a data type is mentioned, it will refer to the abovementioned types.
- However, the data types discussed ahead refer to the variables/samples you come across when performing statistical computing or various data science operations.
While one can divide the variables based on the aforementioned data types, categorizing the data discussed ahead is more beneficial from a data mining and statistical computing point of view
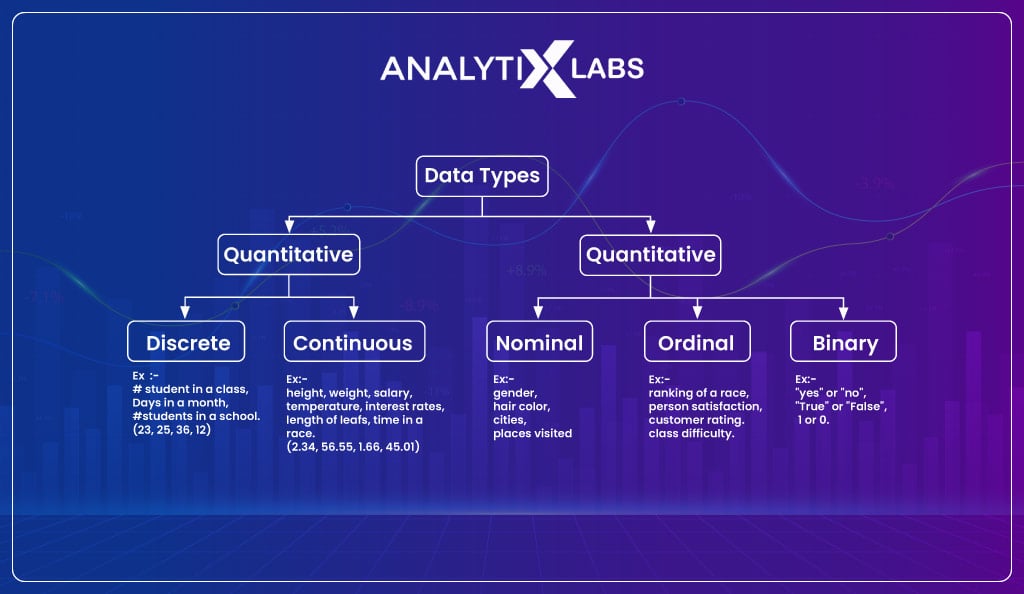
Data is of two types:
- Quantitative
- Qualitative
Quantitative Data
Quantitative data refers to data that is generated by counting or measuring something. Generally, quantitative refers to numerical data.
It’s important to note that by numerical, it doesn’t mean the data type will be numeric as, in some cases, it can be string too. By numeric data type, we mean that it represents a number that can be counted.
For example, if a variable in a dataframe provides the number of cars a household has and has values such as ‘one,’ ‘two,’ ‘three,’ and so on, then this variable will be considered quantitative data even when its data type is ‘string’.
Therefore the quantitative data can have a numeric data type and a string/character. This is because here, the information is gathered by counting something, and if some transformation is done, then statistical analysis can be performed on it.
Thus quantitative data answers questions of the type ‘how many’, ‘how much’, ‘how often’ etc.
Quantitative data can be categorized
- Continuous vs. discrete
- Ration vs. interval and discrete
Continuous vs. Discrete
Quantitative data can be of two types – discrete and continuous.
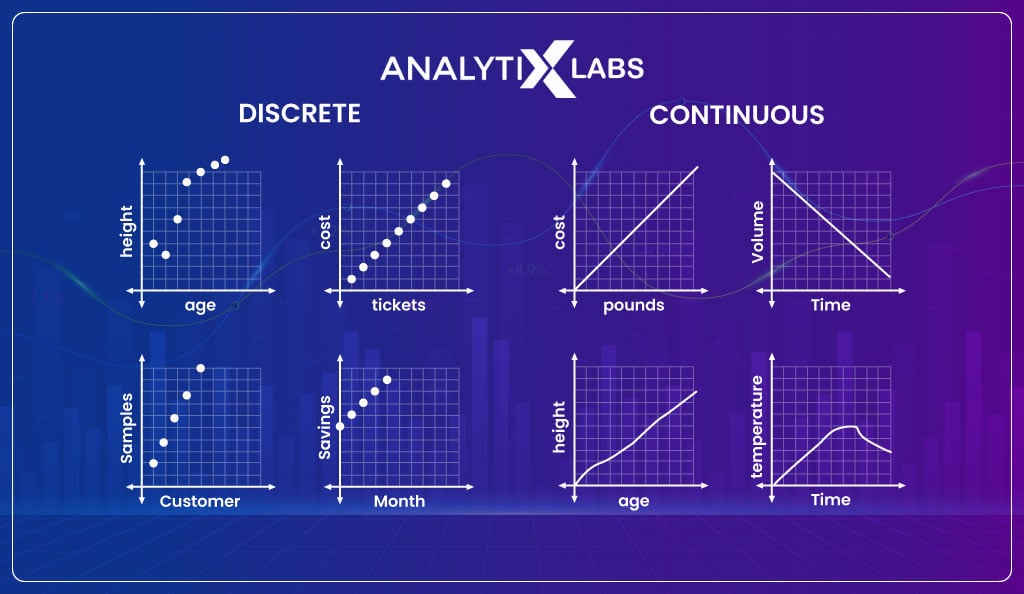
A discrete variable expresses data in countable numbers, i.e., integers. Therefore, data is known as discrete data whenever a count of individual items is recorded.
Typically discrete data includes numeric, finite, non-negative countable integers. Examples of such data include the number of houses, the number of students in a class, etc.
Continuous data differs from discrete data as it may or may not be comprised of whole numbers, can consider any value in a specific range, and can take on an infinite number of values.
Another difference is that decimal numbers of fractions can be there in continuous data, whereas this is not the case with discrete data. Such data include weight, height, distance, volume, etc.
Ratio vs. Interval and Discrete
Another way quantitative data can be categorized is Ratio and Interval data.
Ratio data is where a true zero exists, and there is an equal interval between neighboring points. Here a zero indicates a total absence of a value.
For example, a zero measurement of population, length, or area would mean an absence of the subject. Another example can be temperature measured in Kelvin, where zero indicates a complete lack of thermal energy.
Interval data is similar to ratio data, with the difference being that there is no true zero point in such data.
For example, the temperature measured in Celsius is an example of interval data where zero doesn’t indicate an absence of temperature.
Qualitative Data
Qualitative data is fundamentally different from quantitative data as it can be measured or counted as it is more descriptive. It relies more on language, i.e., characters, than numerical values to provide information.
However, when the qualitative data is encoded, it can be represented through numbers.
Note: Qualitative data is often called categorical data. In contrast, quantitative data is often referred to as numerical data (not to be confused with the numeric data type. As mentioned earlier, in special cases, a numerical data type can have a string as the data type).
Qualitative data can be categorized into:
- Binary
- Ordinal
- Nominal data
Binary Data
Binary Data is also known as dichotomous variables, where there are always two possible outcomes. For example, Yes/No, Heads/Tails, Win/Lose, etc.
Ordinal Data
Ordinal data is where we have different categories with a natural rank order. For example, a variable with pain level has five categories- ‘no pain’, ‘mild pain’, ‘moderate pain’, ‘high pain’, and ‘severe pain’.
Here if you notice, there is a natural order to the categories as the categories can be ranked from the category indicating lower pain intensity to higher.
Identifying ordinal variables is important because when the data is being prepared for statistical modeling, the categorical variable is often encoded, i.e., represented in numbers. The categorical variable type dictates the encoding mechanism to be used.
Label encoding is used for ordinal variables where the categories are ranked, and value labels are provided to them from 1 to N (N being the number of unique categories in the variable).
Ordinal vs. Interval Data
An important thing to note here is that ordinal data can be confused with several other data types. For example, ordinal data, when encoded, can resemble discrete data.
Ordinal data can be confused with interval data.
The difference is that the distance between the two categories is unknown in ordinal data. In contrast, the distance between two adjacent values is known and fixed in interval data.
For example, if data providing a scale of pain from 0 to 10 is there, with 0 indicating no pain to 10 indicating severe pain, then such data is interval.
Here, the values have fixed measurement units that are of equal and known size.
On the other hand, if the data has five categories (‘ no pain’, ‘mild pain’, ‘moderate pain’, ‘high pain’, and ‘severe pain’), then such data will be considered to be ordinal data as we can’t quantify the difference between one category to another.
Nominal Data
Another type of qualitative data is nominal data. Here the categories of the data are mutually exclusive and cannot be ordered in a meaningful way.
For example, if a variable indicates a mode of transportation with categories like ‘bus’, ‘car’, ‘train’, and ‘motorcycle’, then such data is nominal. Other examples can include zip code and genre of music.
Nominal variables are encoded during the data preparation process using a method known as one-hot encoding (also known as dummy variable creation).
It’s important to note that you can get confused between the two types of categorical variables.
For example, the variable indicating the color of a car and having categories like ‘green’, ‘yellow’, and ‘red’ is nominal. In contrast, the same categories can be a part of an ordinal variable where the colors indicate a place’s danger level, with ‘green’ indicating safe and ‘red’ indicating unsafe.
Similarly, a variable indicating the temperature of an object having categories like ‘cold’ and ‘hot’ may seem binary. Still, having more than another category, such as ‘mild,’ is impossible.
With the above discussion, I hope you have gained a decent level of understanding of the various type of data out there. Now that we have a good basis, let’s understand what distribution means.
Learn from AnalytixLabs
You can enroll in our Data Science certification course and our exclusive PG in Data Science course at your convenience, or you can book a demo with us.
What is Distribution?
Distribution is a crucial aspect of statistics. There are many types of statistical distributions to be found that can help you analyze and interpret data.
Let’s start with the definition of distribution. When the term distribution is mentioned in statistics, it means a probability distribution.
In statistics, distribution refers to a parametrized mathematical function (i.e., a mathematical expression) that provides an event’s possible outcomes and how often they can occur.
These functions can be of only three types that will be discussed ahead.
Each probability distribution is created from a table where we have the event on one side and the count of their occurrence in an experiment on the other.
Let’s understand this from an example where you are trying to find the distribution of an event where the event is dice rolling. You know that dice have six sides numbered from 1 to 6. When you roll the dice, the probability of getting 1 is one out of six (unless it’s a loaded dice). Similarly, the probability is one-sixth for all other values (2, 3, 4, 5, and 6).
If you want to find the probability of getting a 7, it would be zero, as it’s impossible to get such a value. Thus, if you draw a table, then it would look something like-
| Event | Probability |
|---|---|
| 1 | 1/6 |
| 2 | 1/6 |
| 3 | 1/6 |
| 4 | 1/6 |
| 5 | 1/6 |
| 6 | 1/6 |
When plotted using a histogram, the distribution will provide a peculiar shape that often helps you understand the distribution you are dealing with. In this case, you will get a uniform distribution.
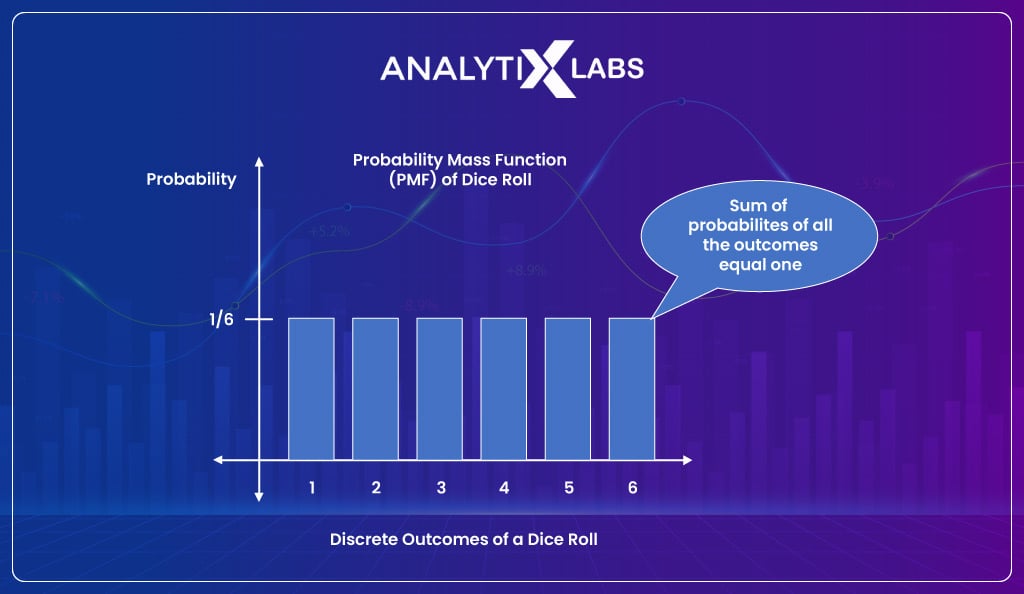
Therefore, using this probability distribution (uniform distribution in this case), you can know that the possible values for a dice roll are 1 to 6, with the probability of getting any value between this range being the same (in this case, it’s 1/6 which is roughly 0.17, i.e., 17%).
Every probability distribution is associated with a graph that helps you understand the likelihood of an event occurring. However, we define the distribution in statistics not based on the graph but rather on the underlying probabilities. Therefore:
Visualizing distribution is an aid that helps you make sense of the distribution.
To further understand distributions, let’s now extend the example.
Suppose you are dealing with two dice now. In this case, what will be the probability of getting the sum of two dice as 2?
Here the total possible outcomes would be (1,1), where both dices return 1, (1,2), where the first dice returns 1 and the second returns 2. Similarly, there will be 36 of such possible outcomes, as follows –
| (1,1) | (2,1) | (3,1) | (4,1) | (5,1) | (6,1) |
|---|---|---|---|---|---|
| (1,2) | (2,2) | (3,2) | (4,2) | (5,2) | (6,2) |
| (1,3) | (2,3) | (3,3) | (4,3) | (5,3) | (6,3) |
| (1,4) | (2,4) | (3,4) | (4,4) | (5,4) | (6,4) |
| (1,5) | (2,5) | (3,5) | (4,5) | (5,5) | (6,5) |
| (1,6) | (2,6) | (3,6) | (4,6) | (5,6) | (6,6) |
Therefore the total possible events are the following-
PS: If you notice, the possible events, i.e., the sum of both the dice, range between 1 to 12.
| Dice #1 | Dice #2 | Event******(sum of two dice)** |
|---|---|---|
| 1 | 1 | 2 |
| 1 | 2 | 3 |
| 1 | 3 | 4 |
| 1 | 4 | 5 |
| 1 | 5 | 6 |
| 1 | 6 | 7 |
| 2 | 1 | 3 |
| 2 | 2 | 4 |
| 2 | 3 | 5 |
| 2 | 4 | 6 |
| 2 | 5 | 7 |
| 2 | 6 | 8 |
| 3 | 1 | 4 |
| 3 | 2 | 5 |
| 3 | 3 | 6 |
| 3 | 4 | 7 |
| 3 | 5 | 8 |
| 3 | 6 | 9 |
| 4 | 1 | 5 |
| 4 | 2 | 6 |
| 4 | 3 | 7 |
| 4 | 4 | 8 |
| 4 | 5 | 9 |
| 4 | 6 | 10 |
| 5 | 1 | 6 |
| 5 | 2 | 7 |
| 5 | 3 | 8 |
| 5 | 4 | 9 |
| 5 | 5 | 10 |
| 5 | 6 | 11 |
| 6 | 1 | 7 |
| 6 | 2 | 8 |
| 6 | 3 | 9 |
| 6 | 4 | 10 |
| 6 | 5 | 11 |
| 6 | 6 | 12 |
If you were to calculate the probability of each event, you need to look at how often that outcome can occur. For example, the probability of getting a sum of two dice as 1 is zero.
The probability of getting the sum as 2 will be 1/36 because this can only happen when both the dice return 1, and of the 36 possible outcomes, there is only one such outcome that returns the sum as 2.
Similarly, the probability of getting the sum 3 would be 2/36 because of the 36 possible outcomes; only two such outcomes return the sum as 3: (1,2) and (2,1).
Therefore if we know the denominator, i.e., the count of outcomes for each event, we can calculate the probabilities.
In the two dice example, the no. of possible outcomes for each event would look like-
| Event | No. of outcomes |
|---|---|
| 2 | 1 |
| 3 | 2 |
| 4 | 3 |
| 5 | 4 |
| 6 | 5 |
| 7 | 6 |
| 8 | 5 |
| 9 | 4 |
| 10 | 3 |
| 11 | 2 |
| 12 | 1 |
Thus, if you were to come up with a probability table for this example, then it would look like-
| Event | Probability |
|---|---|
| 2 | 0.03 |
| 3 | 0.06 |
| 4 | 0.08 |
| 5 | 0.11 |
| 6 | 0.14 |
| 7 | 0.17 |
| 8 | 0.14 |
| 9 | 0.11 |
| 10 | 0.08 |
| 11 | 0.06 |
| 12 | 0.03 |
We can extend such examples to experiments where the sum is calculated based on three of four dice.
In such experiments, the total possible events and the probability for each event will differ, making the distribution take different shapes, as shown below-
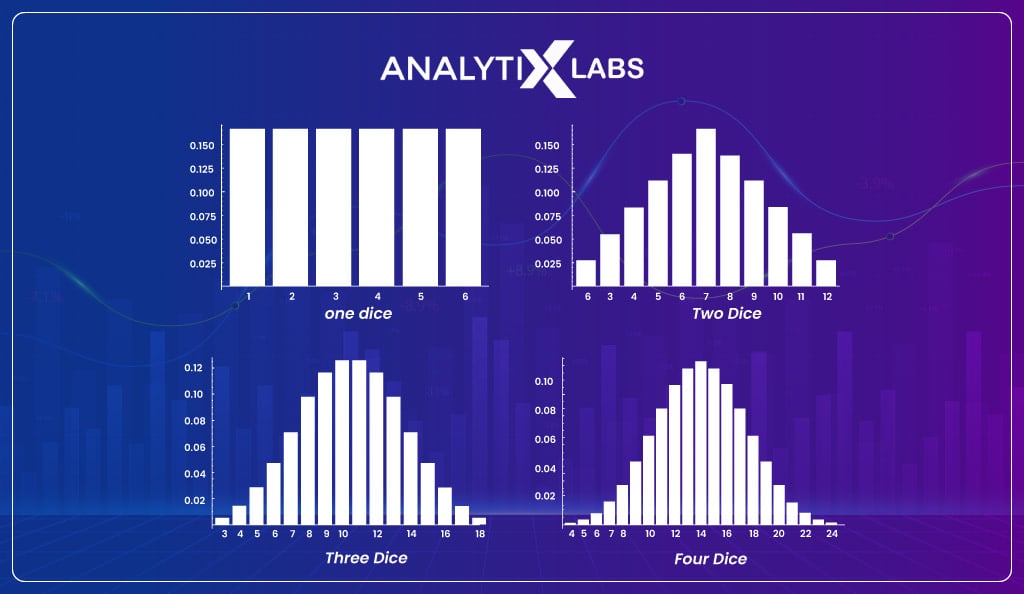
Once you have understood what probability distribution is all about, the next point of discussion is to understand the different types of functions and the broad categories in which the distributions can be divided. Let’s start with the probability functions.
#1. Density function
As mentioned earlier, the probability function provides us with different types of distributions. This is why different distributions are described in terms of their mathematical function or the density function.
The density function explains how the likelihood of a proportion of observations changes over a distribution range. There are broadly three types of density functions-
- Probability Density Function [PDF]
- Probability Mass Function [PMF]
- Cumulative Density Function [CDF]
-
Probability Density Function [PDF]
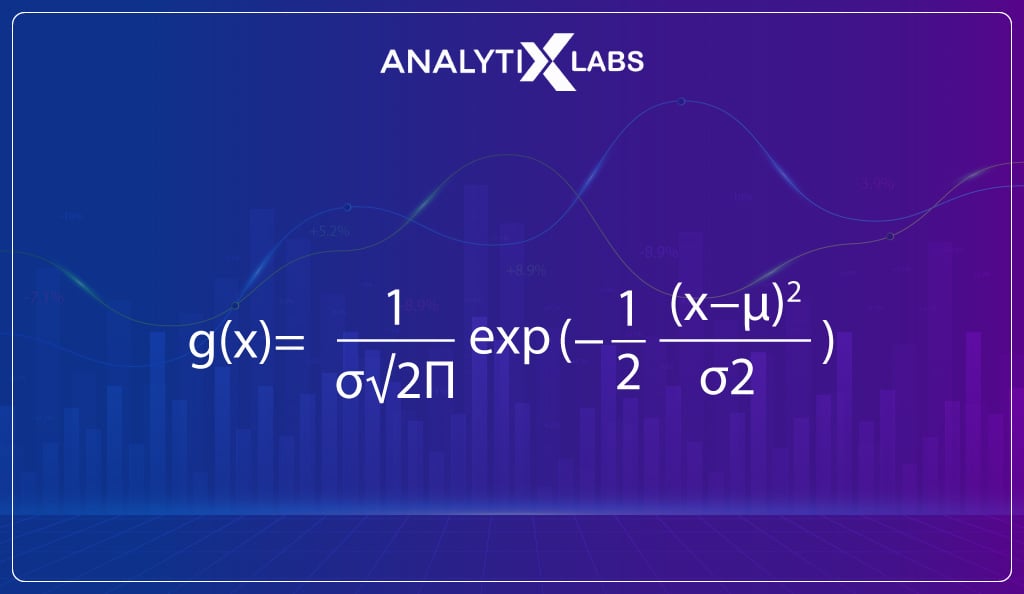
In a distribution to calculate the likelihood of a given observation, the Probability Density Function is used. PDF is used to describe the probability distribution of a continuous random variable. Such a function also summarizes the likelihood of observations across the distribution’s sample space.
A common example of a distribution generated from such a function is the Gaussian distribution.
The formula for PDF is:
-
Probability Mass Function [PMF]
The function that provides the probability distribution just like PDF but for discrete outcomes is known as Probability Mass Function.
If you would have noticed, the distribution function generated from the one-dice example is PMF. It’s important to remember that the sum of all the probabilities from a probability mass function is always one.
The formula for PMF is:
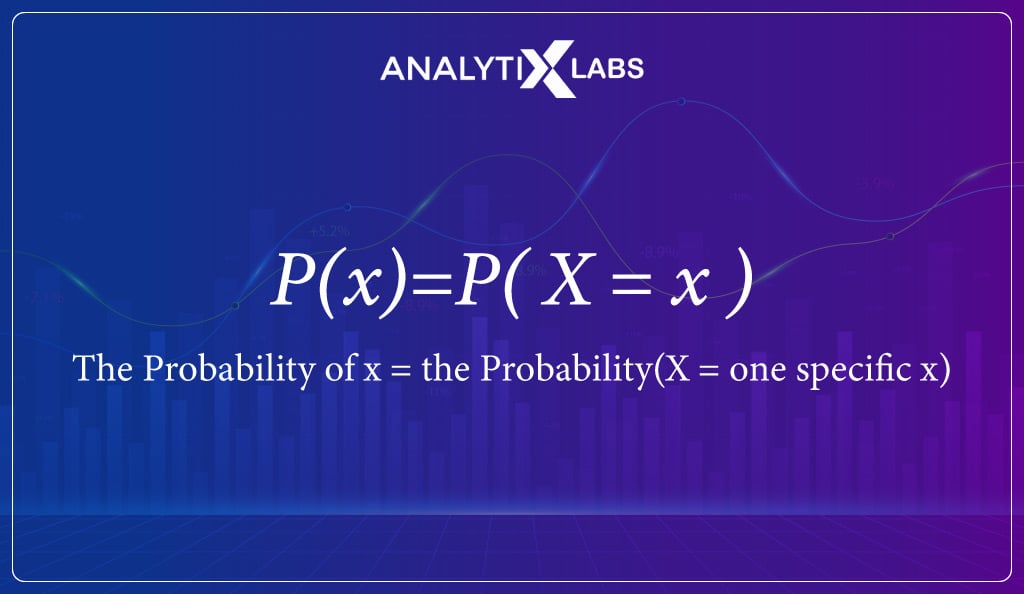
-
Cumulative Density Function [CDF]
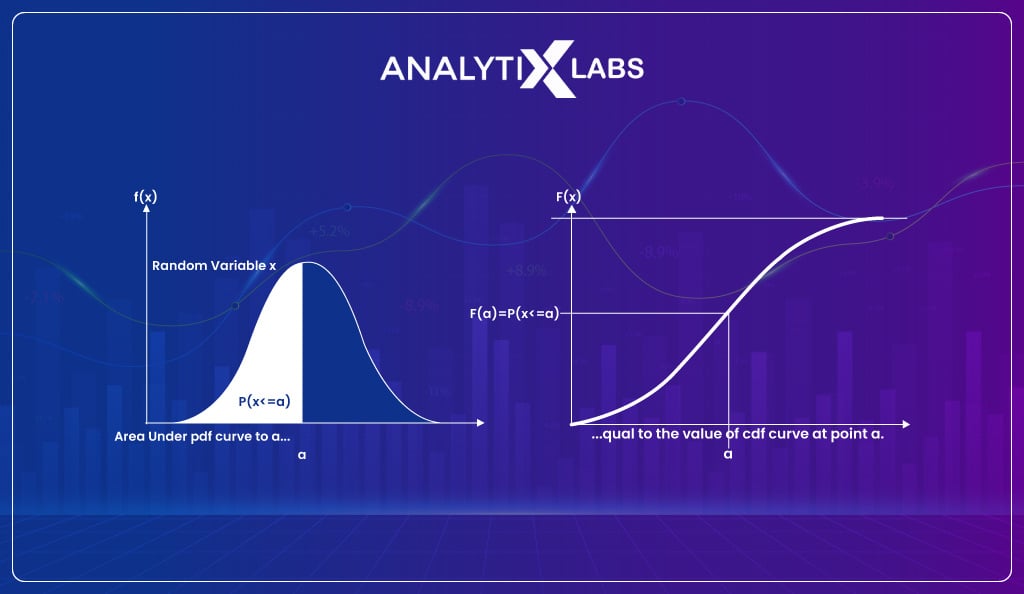
The cumulative density function is a different take on calculating probabilities. It is used when rather than being interested in finding the likelihood of a given observation (as provided by PDF), you are interested in seeing the cumulative likelihood of an observation and all the observations before it in the sample space.
Therefore CDF allows you to determine how much distribution lies before a specific value.
If you take the previously discussed dice roll example and are interested in knowing the probability that the outcome is equal to or less than three, then such a probability would be represented using CDF.
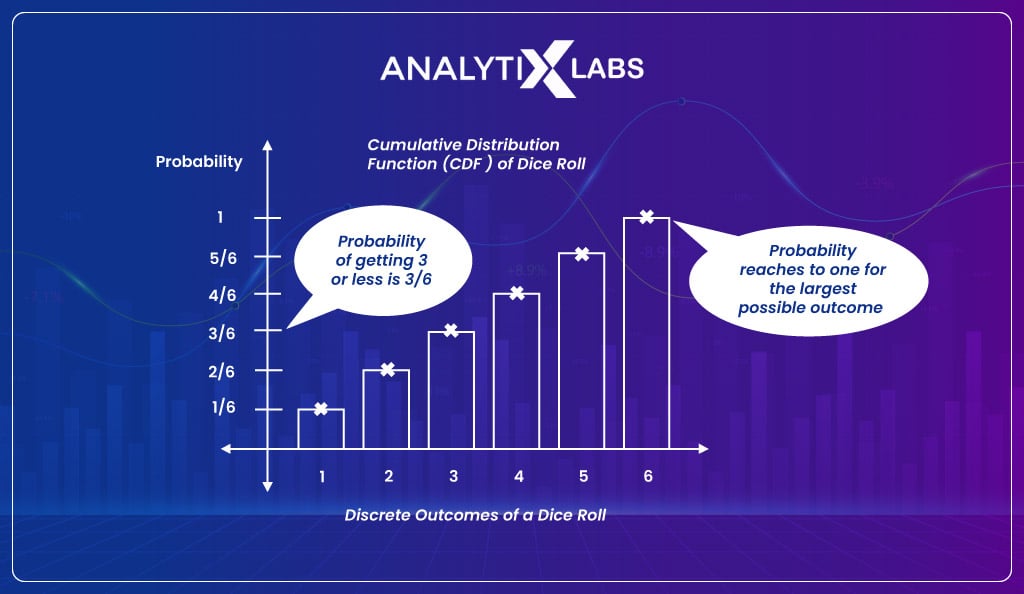
CDF is typically plotted on a curve ranging from 0 to 1 for the distribution. Therefore whenever you need to find the probability less than or equal to a value, you use CDF. The CDF can be used for continuous or discrete variables/data.
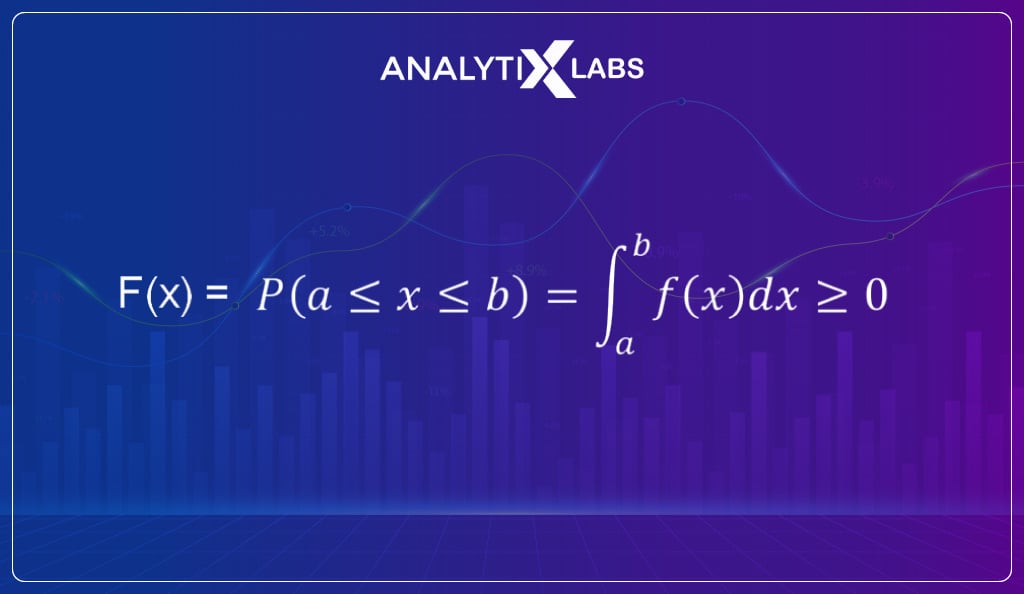
The formula for CDF is:
Distribution Categories
There are multiple ways in which distribution can be categorized, and the most common ones include the following:
- Continuous vs. discrete
- Symmetric vs. asymmetric
- Unimodal vs. bimodal vs. multimodal
- Univariate vs. multivariate
-
Continuous vs. discrete
Distribution can be divided based on the type of data being used. As discussed in the type of data section, quantitative data can be divided into continuous and discrete. Therefore, there can be continuous and discrete distributions.
-
Symmetric vs. asymmetric
Another way of categorizing distribution can be based on the symmetry of the distribution’s graph. The values appear at regular frequencies around the mean in a symmetric distribution.
Visually speaking, if you split such a distribution’s graph from the middle, you will get two mirror images of one another.
Examples of such distribution include Uniform and Gaussian distribution. Asymmetric distribution is different from symmetric because it is skewed.
-
Unimodal vs. bimodal vs. multimodal
The distribution can also be categorized based on the number of modes. The values with the highest data frequency are considered to be its mode.
If data has more than one such value, i.e., has more than one mode, then such data is known as bimodal, and the distribution based on such data is called bimodal distribution. If the number of modes exceeds two, such a distribution is called multimodal.
-
Univariate vs. multivariate
Lastly, the distribution can also be categorized based on the number of variables involved in creating the distribution. When a single random variable is involved, such a distribution is known as univariate distribution.
There is, however, another kind of distribution known as the multivariate distribution that provides a comparison between two or more measurements and also provides the relationship between them. Typically for each univariate distribution, there is a general multivariate distribution.
This can be understood from the normal distribution example, where it is univariate but has a more general counterpart known as the multivariate normal distribution (aka. normal joint distribution), which is a generalization of the one-dimensional distribution to higher dimensions.
Also read: Understanding Univariate Analysis
As you now understand distributions and their categorizations, let’s explore the various distributions you commonly encounter.
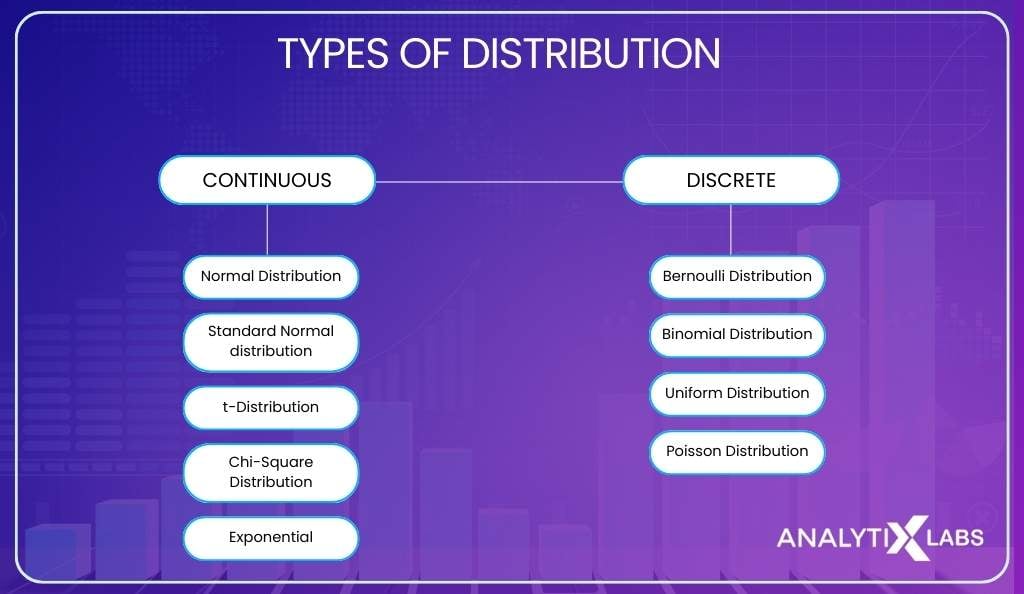
Types of Distribution
As mentioned above, distribution types can be divided into continuous and discreet statistics. The common discrete probability distributions are Binomial, Multinomial, Bernoulli, Poisson, and common continuous distributions are normal distribution, t-distribution, etc.
(Note- all the functions mentioned below are PDF/PMF).
Continuous Distribution
-
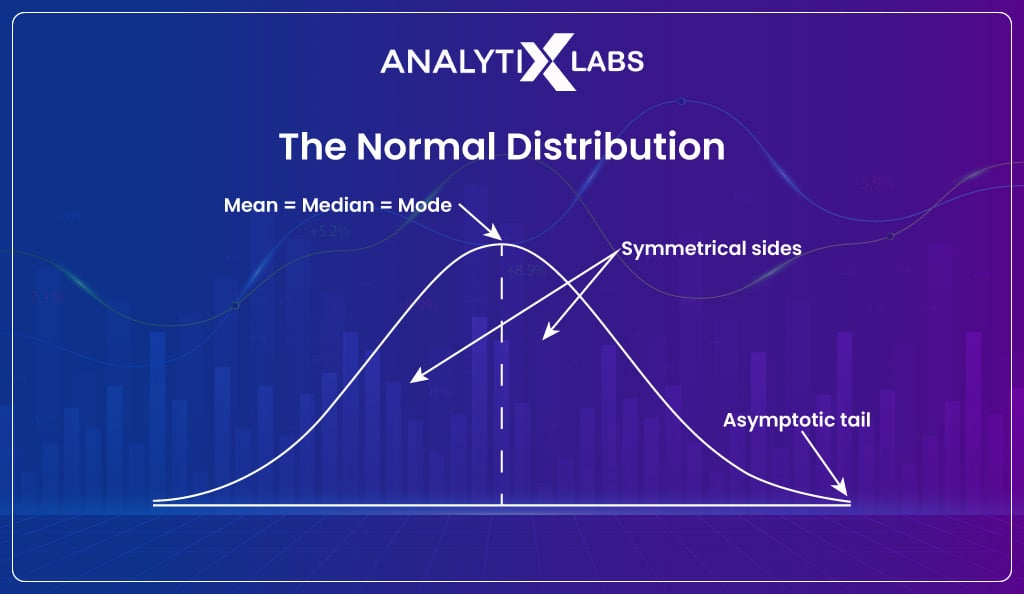
Normal distribution
Of the different types of distributions out there, the most used distribution in statistics and data science is Normal, also known as the Gaussian distribution.
A normal distribution is a symmetrical distribution with a bell-shaped curve, where most values are clustered around the center and tapering off as you move away from the center. The unique property of normal distribution is that its mean, medium, and mode are all equal.
This distribution is the most common because it gets generated from the central limit theorem (CLT).
Before understanding CLT, let’s first understand sampling distribution.
Also read: Sampling Techniques in Statistics
If you collect a random sample, let’s say a random sample where you collect data from 100 individuals about their age and calculate its mean, and if you then repeat this process 1,000 times (a minimum of 30 samples are required for CLT to be true) and plot these means then what you get is a sampling distribution.
As per CLT, the mean of the sampling distribution and population (from where the samples have been drawn) is equal. Also, the sampling distribution will follow a Gaussian distribution regardless of the distribution of the population.
Because of CLT, most samples collected by various individuals and organizations follow a Gaussian distribution.
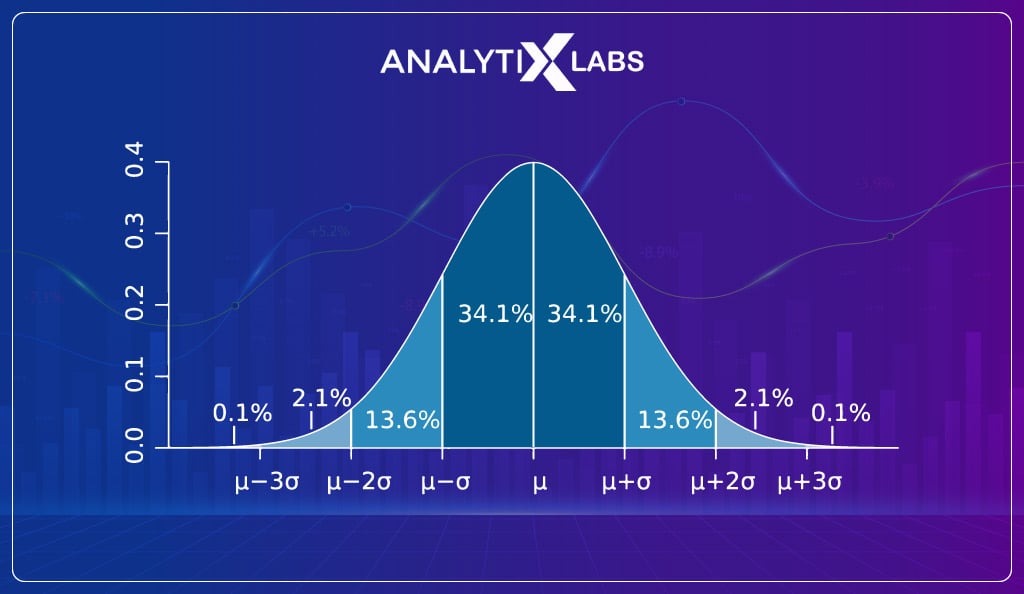
As Gaussian distribution follows a 68-95-99.7 rule which states that in such distribution, 68% of values lie within one standard deviation from the mean, 95% within 2 and 99.7% within three, it makes it easy to understand the probability of finding a value in the population.
This concept is further extended by hypothesis tests like the Z-test that allow statisticians to find the probability of finding any value in the population by using the sampling distribution.
The formula for Gaussian distribution is:
-
Standard normal distribution
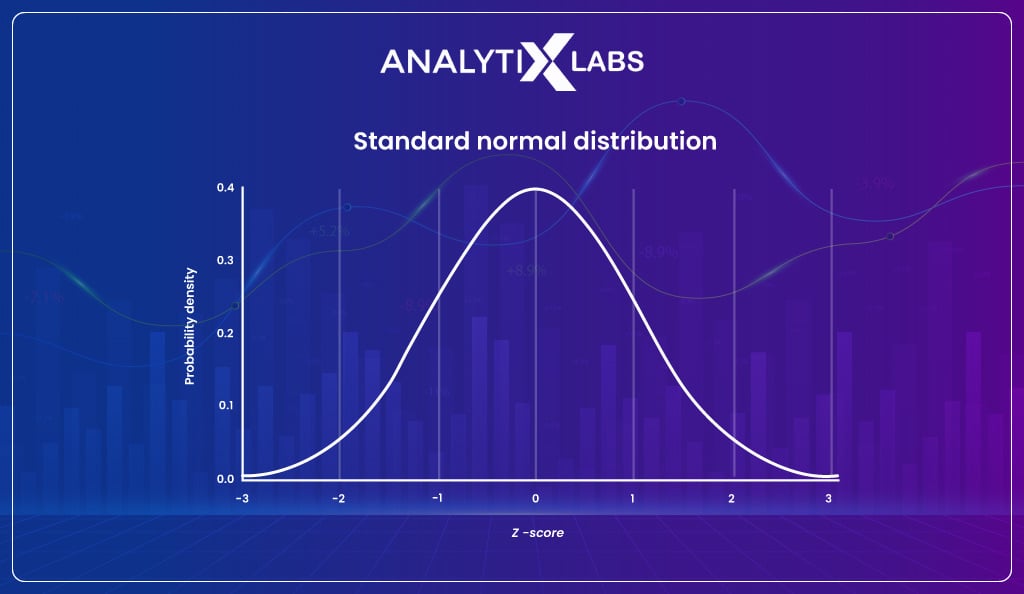
The standard normal distribution is the same as a normal distribution, with the difference being that the values used to generate the distribution have been standardized. The values are standardized by calculating the z score where the formula for the z score is-
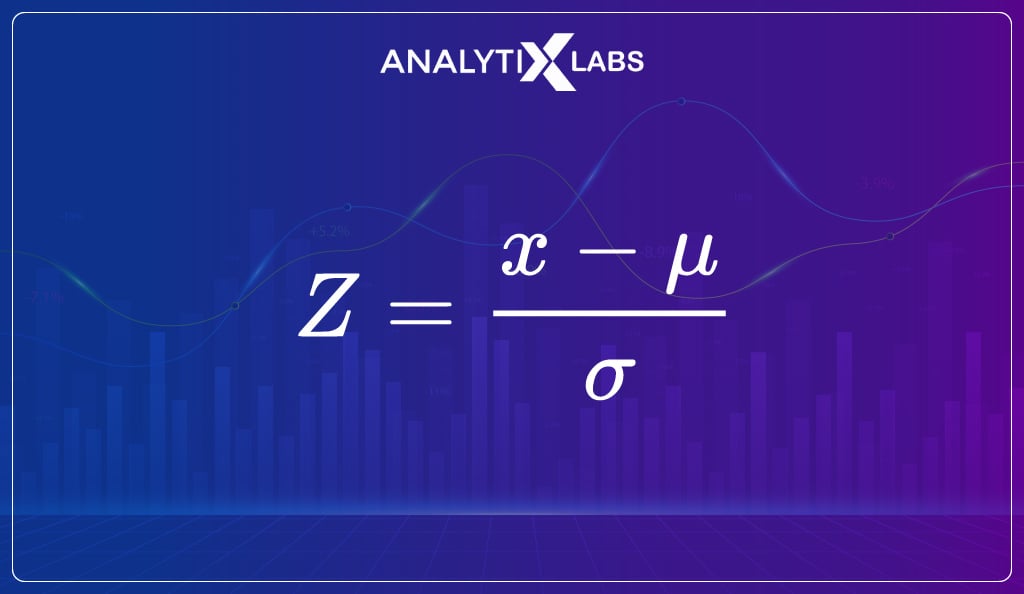
If you convert every value into a z score and plot the distribution, then such a distribution will look just like and have the same characteristics as the total distribution.
Still, as the values have been standardized, the mean of this sampling distribution is always zero, and the standard deviation is one.
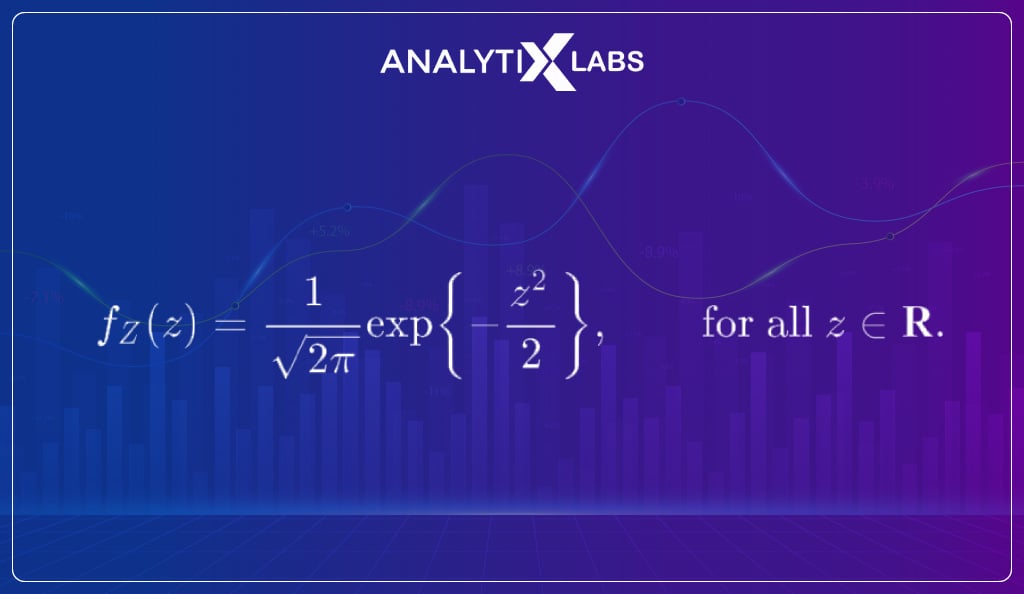
The formula of standard normal distributon is-
-
t-distribution
t-distribution, also known as the student t-distribution, is very similar to the normal distribution because, just like a normal distribution, it too has a bell-shaped curve and heavier tails.
The main difference here is that such a distribution gets created when the sampling distribution is created from a sample size of less than 30. And as the sample size is less than 30, CLT doesn’t come into effect, and the distribution cannot be considered normal.
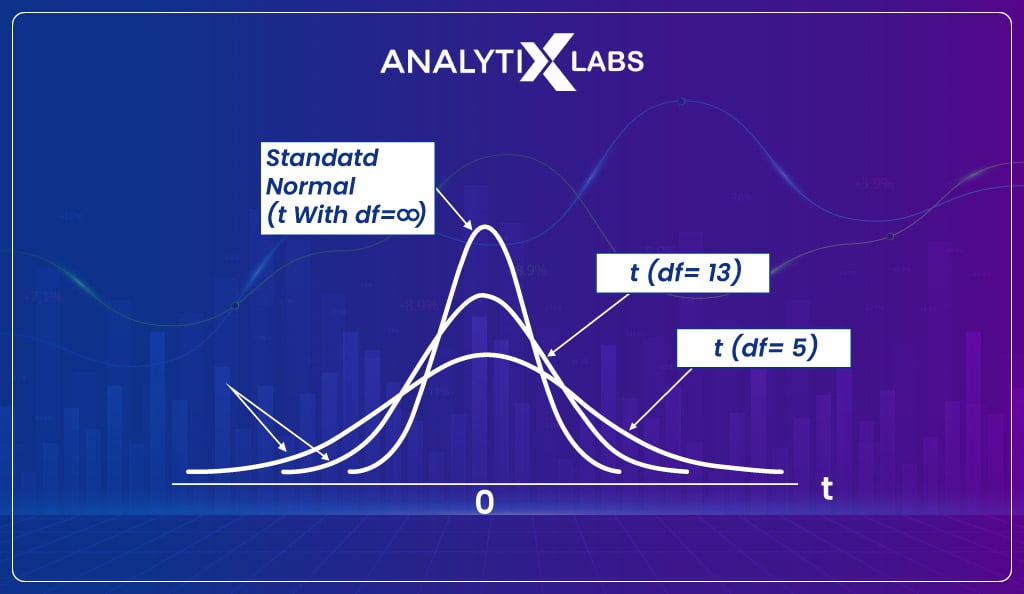
Unlike the Gaussian distribution, where we get a single type of distribution once CLT comes into effect, the t-distribution depends on the degree of freedom.
Each degree of freedom has a slightly different distribution, with the difference being in the shape and the probability values. The degree of freedom for t-distribution is n-1, where n is the number of samples from which the sampling distribution is created.
The t-distribution is highly important as hypothesis tests like t-tests are conducted when the data is limited, and the population is to be estimated. The formula of t-distribution is-
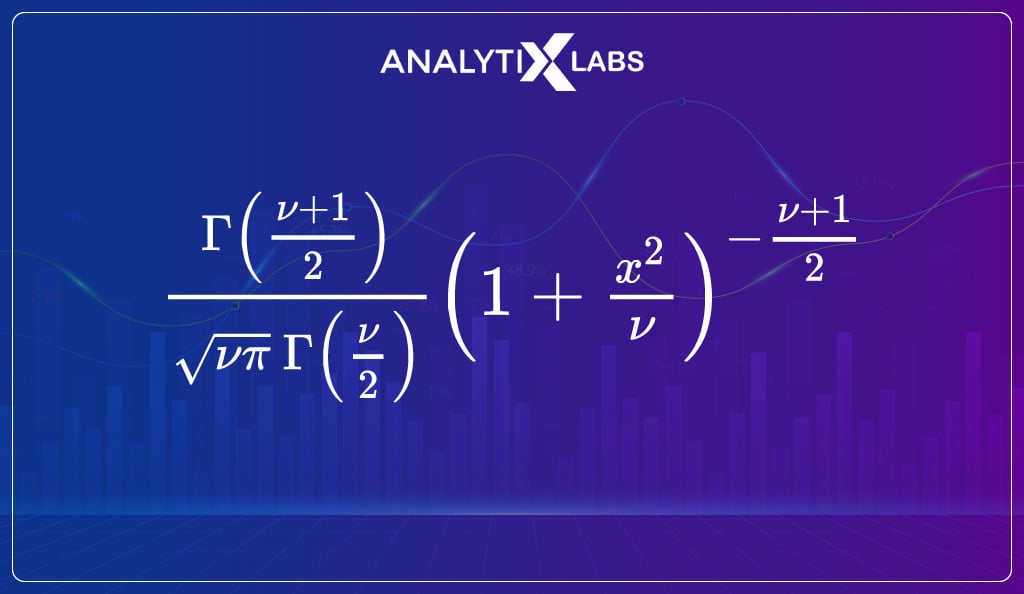
-
Chi-square distribution
A chi-square distribution is typically used when conducting a hypothesis test to understand the relationship between two nominal categorical variables.
Apart from hypothesis testing, the distribution can also be used to understand the goodness of fit and compute a confidence interval.
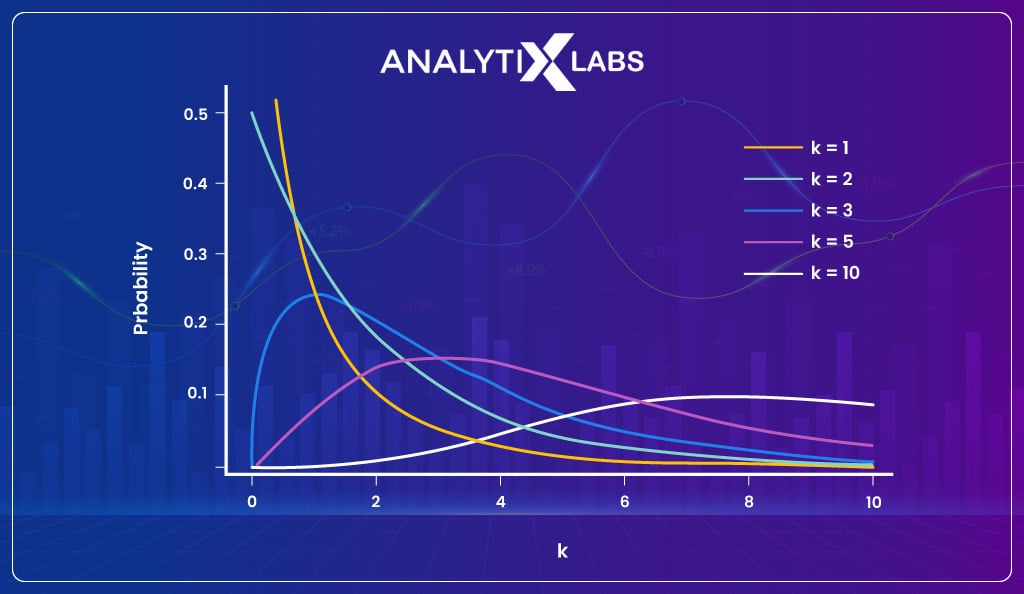
The chi-square distribution is derived by transforming the t-distribution, where the chi-square is found when you set the t-distribution to a power of 2. The formula of a chi-square distribution is-
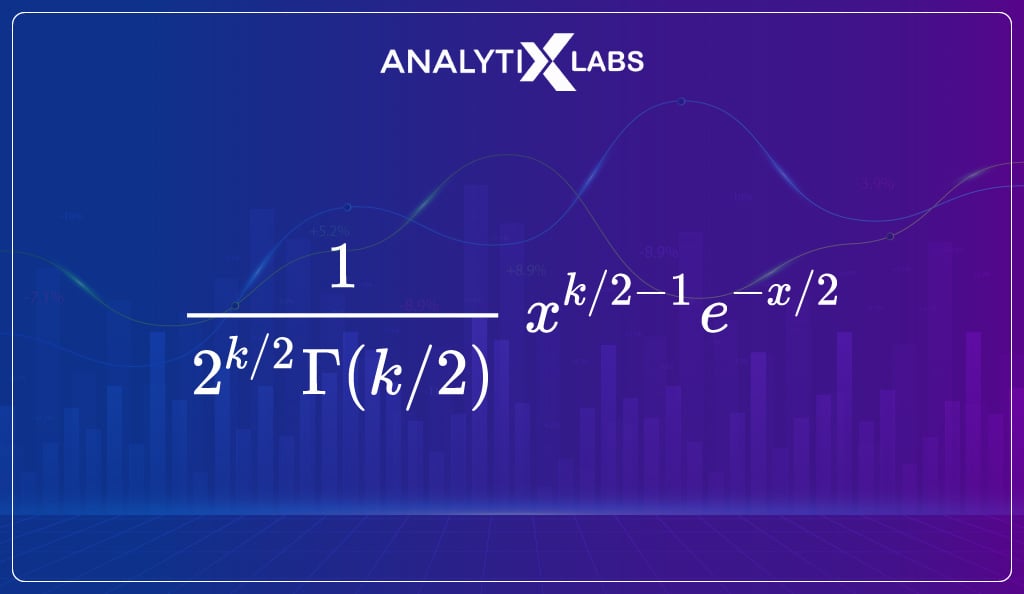
-
Exponential
The subsequent most widely used distribution after the normal distribution is the exponential distribution. The exponential distribution is used when there is a need to model the time between different events, such as calculating product reliability.
Other common examples where you can come across exponential distribution are in
- Physics, where you are measuring radioactive decay
- Engineering, where on an assembly line, you are measuring the time associated with receiving defective parts
- Finance, where for a portfolio of financial assets you are measuring the likelihood of default
You find a curved line in an exponential graph where the probability changes exponentially.
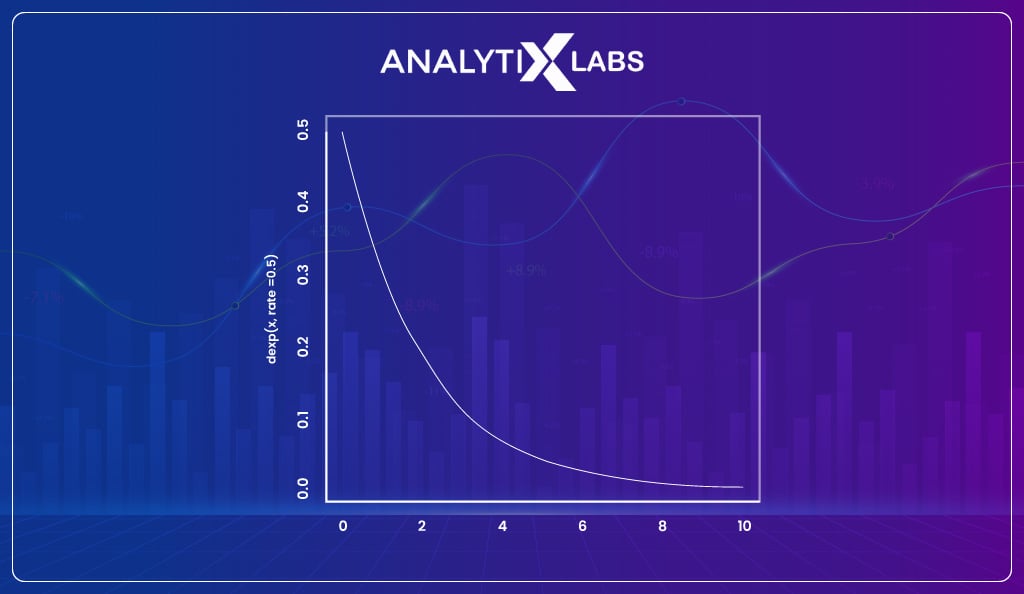
The formula for such a graph is-
f (x) = ax
where,
- “x” is a variable
- “a” is a constant (the base of the function which should be greater than 0)
An exponential function can be in any one of the forms shown below-
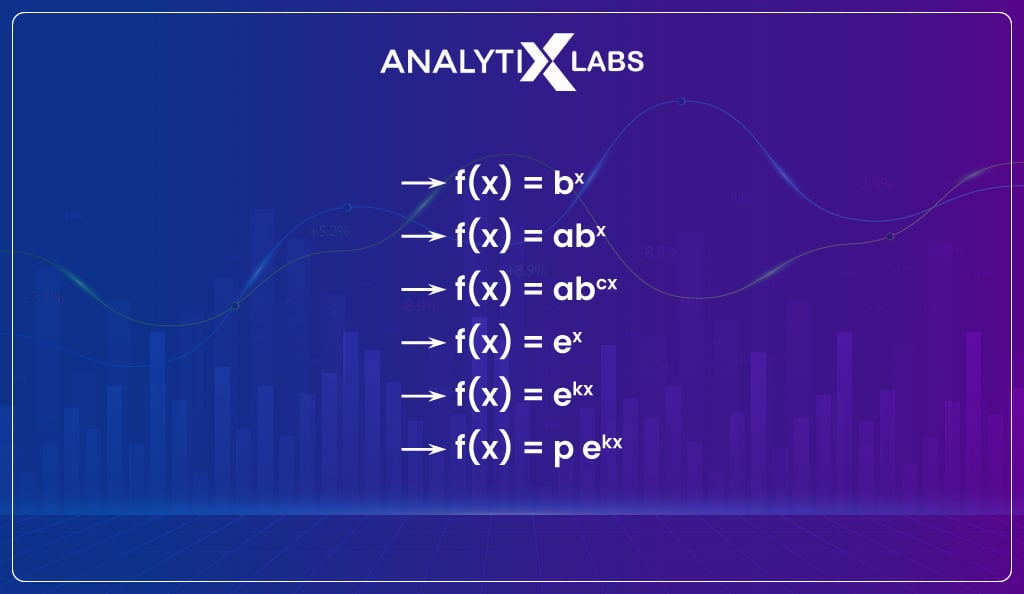
This is by no means an exhaustive list, and there are a few other crucial distributions that you should explore, such as F distribution, gamma distribution, etc.
Discrete
-
Bernoulli distribution
The Bernoulli distribution is considered one of the simplest of the many different types of distributions. Bernoulli distribution is used when you are dealing with binary data. In Bernoulli distribution, an event has a single trial that can have only two possible outcomes.
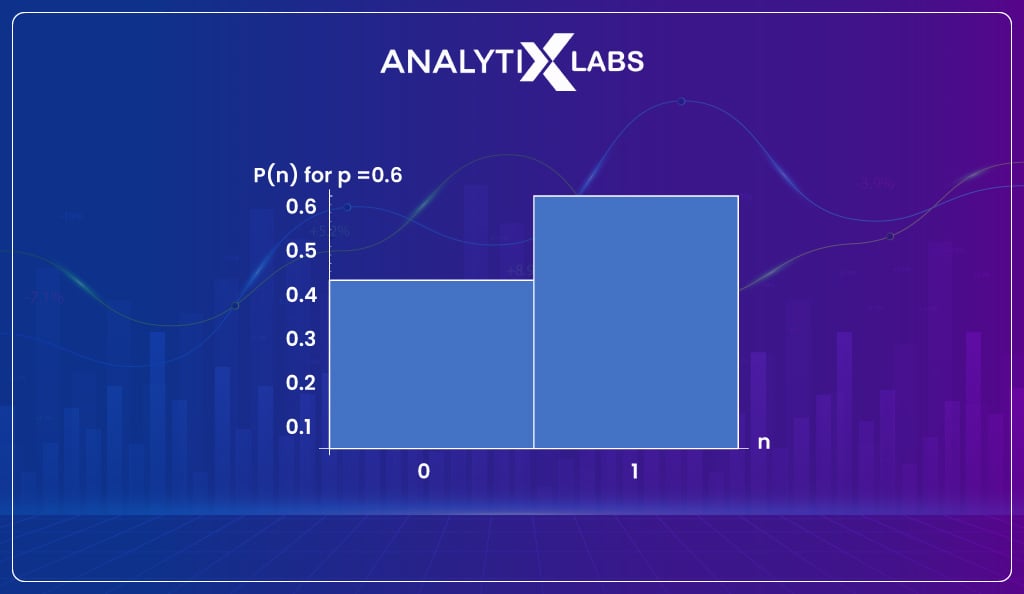
A perfect example of Bernoulli distribution is a count toss where the coin is loaded. Typically for a Bernoulli distribution, we have the probability of one outcome, and the probability of the other is deduced by subtracting the probability from one.
The formula for Bernoulli distribution is-
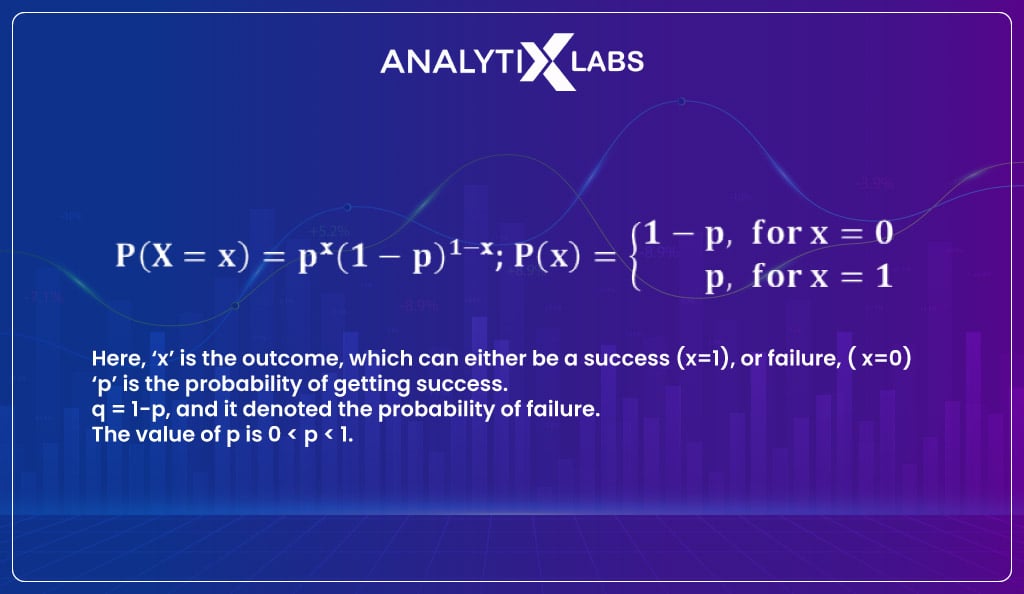
-
Binomial distribution
The binomial distribution expands the Bernoulli distribution as it is a sequence of Bernoulli distributions. Therefore you can think of Binomial distribution as the sum of outcomes of an event following a Bernoulli distribution.
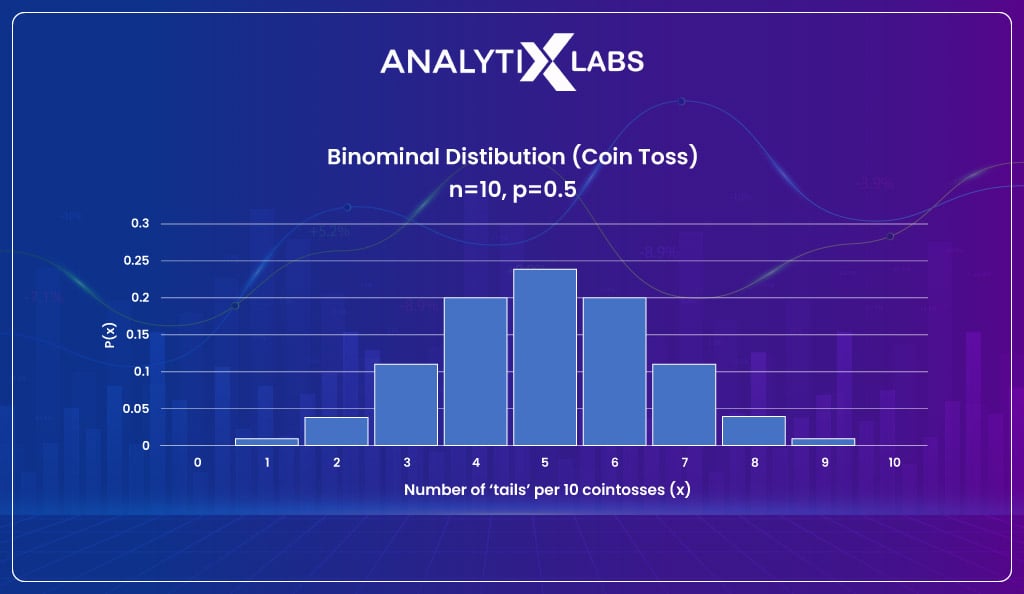
For this reason, the distribution is binomial for binary variables (where the outcome events are binary).
The formula of Binomial distribution is-
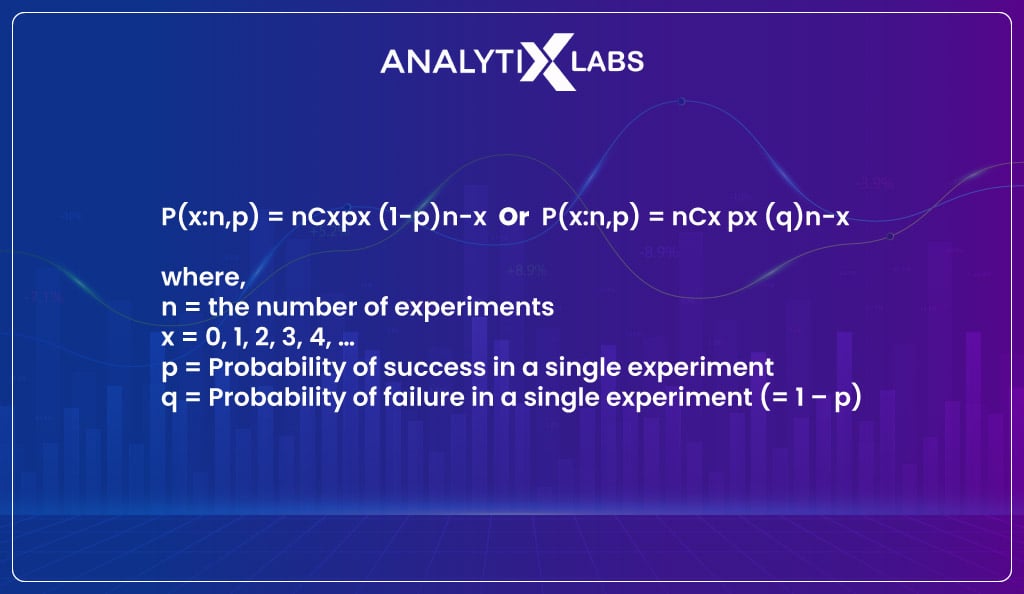
-
Uniform distribution
It’s a statistical distribution where the likelihood of all outcomes is equal. The experiment of rolling a dice discussed earlier provides a uniform distribution. The function of uniform distribution is u(a, b) where a is the minimum value and b is the maximum value.
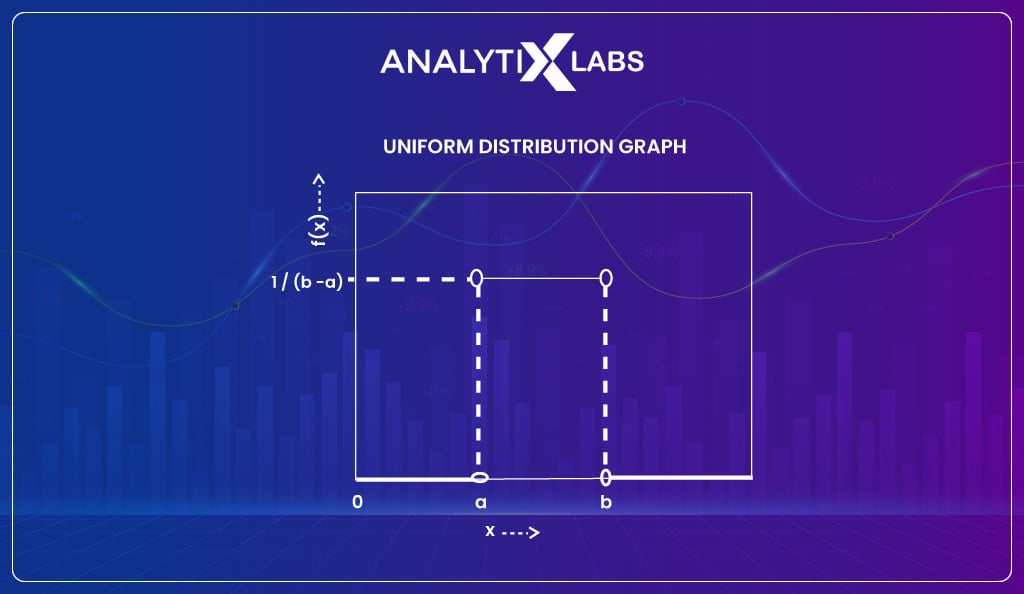
You must note that uniform distribution also exists for continuous data. An example of such a distribution could be a random number generator. The probability function for such a distribution is f(x) = 1/ (b-a) for a≤ x ≤b.
-
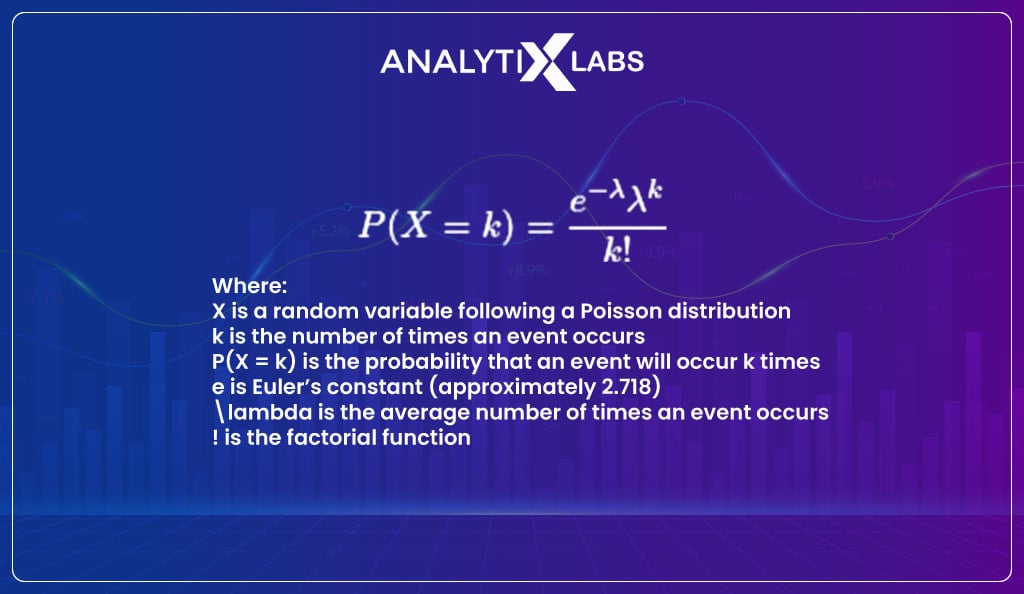
Poisson distribution
When within a specific interval, the frequency with which an event occurs is to be measured, then Poisson distribution comes into play. The Poisson distribution must know how often an event occurs in a particular period (or distance).
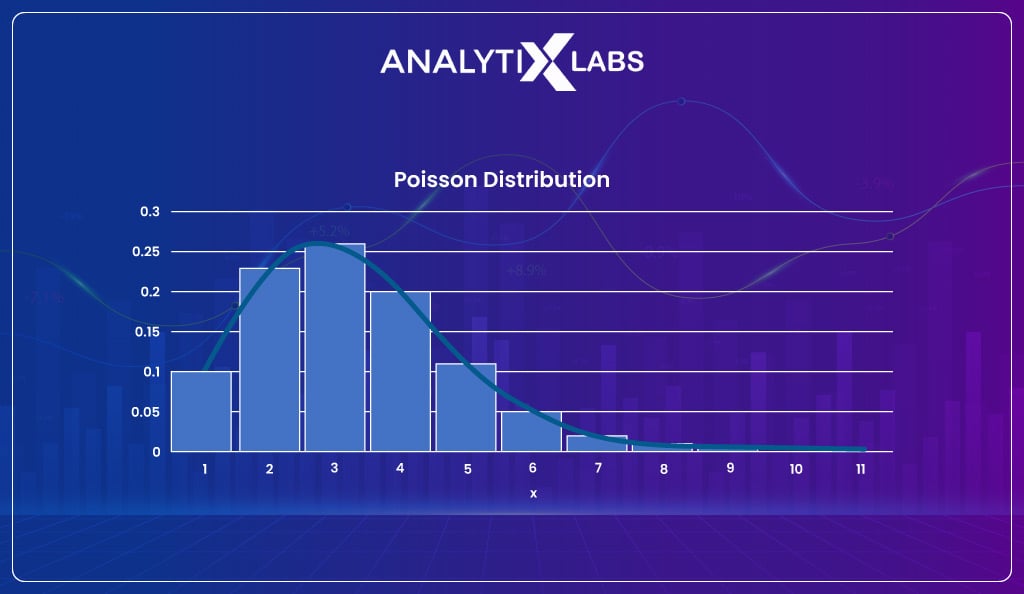
Let’s understand this with an example.
Suppose a bird chirps twice in 6 seconds; then, we can use the Poisson distribution to calculate the likelihood of it chirping four times in 13 seconds.
The function of a Poisson distribution looks like-
As there are so many distributions out there, they must be serving some purpose that so much attention is paid to them in statics.
The next section explores the reasons why different types of distribution are considered so important.
Importance of Types of Distribution
Samples are the single most crucial aspect of statistics. A sample is a subset of the population, as often, it isn’t easy to get data on the whole population.
Statisticians and Data Scientists, therefore, need to analyze this sample data and draw inferences about the population from which the sample has been drawn.
The sampling distribution, i.e., the distribution obtained from using the sample data, makes it possible for us to analyze the characteristics of the population.
For example, you surveyed the city of Mumbai and collected a sample of 10,000 people about their age. Based on the distribution obtained from the data, you can calculate probabilities (such as the probability of finding a person above 60) and estimate the population’s characteristics.
The above idea is then further expanded such that distributions form the backbone of hypothesis testing.
In hypothesis testing, assumptions regarding the population are tested using a sample. The hypothesis tests are based on the type of distribution, making distribution a crucial element of statistics and its related field, such as data science.
Also read: Parametric vs. Non-parametric test: Which one to use for Hypothesis Testing?
Relation between different types of distribution
An interesting fact about a probability distribution is that there are numerous and often surprising numbers of interconnections between different distributions. While some of these relationships are approximate, many of them are exact.
Look at the table below to know the various types of distributions you can derive from a single distribution if you perform certain specific actions.

Let us look at a comparative study between the types of distributions.
Reference material: Distribution chart
| Type of Distribution | Distribution | Action | Resultant Distribution |
|---|---|---|---|
| Discrete (Univariate) | Bernoulli distribution | Take the sum of the independent Bernoulli random variable | Binomial distribution |
| Before a 1 shows up, record the number of 0s obtained and observe a sequence of realizations of independent Bernoulli random variables | Geometric distribution | ||
| Assign a Beta prior to the probability such that a Bernoulli variable == 1 and then update the prior once you observe a realization of the Bernoulli variable. | Beta distribution | ||
| Binomial distribution | Parameter for the number of trials to be set to 1. | Bernoulli distribution | |
| Continuous (Univariate) | Exponential distribution | Take the sum of independent exponential random variables with a common rate parameter. | Gamma distribution |
| As long as the sum is less than 1 keep summing the realizations of independent exponential random variables and then record the number of variables you have summed. | Poisson distribution | ||
| Normal distribution | Consider n mutually independent standard normal variables, square them, and sum the squares. | Chi-square distribution | |
| Consider n mutually independent zero-mean normal variables, square them, and sum the squares. | Gamma distribution | ||
| Consider a linear combination of n mutually independent normal variables. | Normal distribution | ||
| Add a constant or/and multiply by a constant. | Normal distribution | ||
| Take Z (a standard normal variable), independent of a variable (let’s call it X) having a chi-square distribution with degrees of freedom being n. Then, compute Z/sqrt(X/n). | Student’s t distribution | ||
| Take the exponential. | Log-normal distribution | ||
| In a vector, collect n independent normal random variables. | Multivariate normal distribution | ||
| Chi-square distribution | Sum two independent chi-square random variables. | Chi-square distribution | |
| Multiply by a strictly positive constant. | Gamma distribution | ||
| Take X (a chi-square variable) having n as its degrees of freedom, independent of a standard normal variable Z. Then, compute Z/sqrt(X/n). | Student’s t distribution | ||
| Take two chi-squared variables, X1 and X2, with one chi-square variable (X1) having n1 degrees of freedom, independent of another chi-square variable (X2) having n2 degrees of freedom. Then, compute (X1/n1)/(X2/n2). | F distribution | ||
| The covariance matrix is to be divided by an independent chi-square variable before drawing a vector from a multivariate normal distribution. | Multivariate t distribution | ||
| Gamma distribution | Multiply by a strictly positive constant. | Gamma distribution | |
| The two parameters are to be set in a certain special manner (depending on parameterization). | Chi-square distribution | ||
| Take G (a Gamma random variable) independent of Z (a zero-mean normal variable). Then, compute Z/sqrt(G). | Student’s t distribution | ||
| The covariance matrix is to be divided by an independent Gamma random variable before drawing a vector from a multivariate normal distribution. | Multivariate t distribution | ||
| Divide several independent Gammas by their sum. | Dirichlet distribution | ||
| Student’s t distribution | Let the parameter – degrees-of-freedom go to infinity. | Normal distribution | |
| Beta distribution | Set the two parameters equal to 1. | Uniform distribution | |
| In a Bernoulli experiment, assign a Beta before the probability of success and then update the prior after you observe the experiment’s outcome. | Beta distribution | ||
| Log-normal distribution | Take the natural logarithm. | Normal distribution | |
| Discrete (Multivariate) | Multinoulli distribution | For one entry of a Multinoulli random vector, compute the marginal distribution. | Bernoulli distribution |
| Sum n iid Multinoulli vectors. | Multinomial distribution | ||
| Multinomial distribution | Set the number-of-trials parameter to 1. | Multinoulli distribution | |
| Of one entry of a multinomial random vector, compute the marginal distribution. | Binomial distribution | ||
| Continuous (Multivariate) | Multivariate normal distribution | The number of entries of a multivariate normal random vector is to be set equal to 1. | Normal distribution |
| For one of the entries of a multivariate normal random vector, compute the marginal distribution**.** | Normal distribution | ||
| Take a linear transformation. | Multivariate normal distribution | ||
| Sum n independent multivariate normal random vectors. | Multivariate normal distribution | ||
| Use a multivariate normal random vector and a symmetric idempotent matrix to build a quadratic form. | Chi-square distribution | ||
| Calculate the outer products of n iid zero-mean multivariate normal random vectors and take the sum of it. | Wishart distribution | ||
| Divide the covariance matrix by an independent chi-square variable before drawing a vector from a multivariate normal distribution. | Multivariate t distribution | ||
| Divide the covariance matrix by an independent Gamma random variable before drawing a vector from a multivariate normal distribution. | Multivariate t distribution | ||
| Multivariate t distribution | The no. of entries of a multivariate t vector is to be set equal to 1. | Student’s t distribution | |
| Of one entry of a multivariate t vector, compute the marginal distribution. | Student’s t distribution | ||
| Dirichlet distribution | The no. of entries of a Dirichlet vector should be set equal to 1. | Beta distribution |
As you can see, the various distribution functions are interconnected, and you can derive several others from one distribution.
Before we conclude this discussion on distributions, let’s address a common confusion when exploring the world of distributions – the difference between frequency and probability distribution.
Frequency vs. Probability Distribution
To understand the difference between frequency and probability distribution, first understand what frequency means here.
Frequency refers to the number of observations of a specific outcome in an experiment. A frequency distribution is data dependent generated from one or a set of experiments.
For example, you toss a coin ten times where the frequency of getting H (head) is 6 and T (tails) is 4. This would mean that the probability of getting heads is 0.6, and the tails are 0.4.
However, if we rerun the experiment, we could get different probabilities for H and T. In a fair coin toss, the probability of getting H and T is 0.5, the real probability distribution. However, we can get to this distribution by experimenting many times.
Such a distribution is called frequency data distribution in statistics.
The probability distribution, on the other hand, is not dependent on such data from trials as it’s a mathematical concept that captures the nature of the event and therefore represents the ‘real’ probability distribution.
You might be tempted to think one should always use the probability distribution and avoid the abovementioned frequency data distribution in statistics. Still, you must understand that knowing the true distribution is often difficult or even impossible.
The frequency distribution based on the experiment data is the proxy for the underlying probability distribution. Thus in many methods, such as Monte Carlo, the principle of using frequency distribution to estimate the true distribution is used for drawing inference.
In Conclusion
Understanding distributions is crucial for anyone working in a domain that requires you to get in touch with statistics, especially inferential statistics. Most distributions can be understood by understanding the various types of data, probability functions, etc. Therefore, you must focus on these subjects.
FAQS: Types of Distribution
- What are the two types of distributions?
The two types of distribution are continuous and discrete distribution.
- What is the classification of distribution?
The distribution can be classified in multiple ways, such as continuous v/s discrete, symmetric v/s asymmetrical, and unimodal vs. multimodal. Therefore there are many ways of categorizing distributions.
- How many types of distribution are there?
There are many types of distributions stemming from the broader category of continuous and discrete distribution, such as
- Normal Distribution (Continuous)
- Standard Normal Distribution (Continuous)
- Chi-Square Distribution (Continuous)
- F-Distribution (Continuous)
- t-Distribution (Continuous)
- Bernoulli Distribution (Discrete)
- Uniform Distribution (Discrete)
- Binomial Distribution (Discrete)
- Poisson Distribution (Discrete)
Additional Reading Resources