Data analytics deploy many techniques with their use and advantages. These techniques include methods to describe data, understand relationships between variables, and assess how a feature set can have a combined effect on a variable. In this article, we will go over these techniques, especially, the univariate analysis.
Let’s get started.
What is Univariate Analysis?
Before we get into what is univariate analysis, let’s first understand the meaning of ‘univariate’.
While ‘uni’ means one, variate indicates a variable. Therefore, univariate analysis is a form of analysis that only involves a single variable. In a practical setting, a univariate analysis means the analysis of a single variable (or column) in a dataset (data table).
Among all the forms of analytical methods that data analysts practice, univariate analysis is considered one of the basic forms of analysis. It is typically the first step to understanding a dataset. The idea of univariate analysis is to first understand the variables individually. Then, you move into analyzing two or more variables simultaneously. There are specific steps to do this, which are discussed next.
Steps to conduct univariate analysis
There are 4 steps to conducting univariate analysis, as follows:
- Accessing the dataset of interest
- Identifying the variable that needs to be analyzed
- Identifying the questions that need to be answered through the analysis
- Determining the appropriate type of univariate analysis techniques to answer the above-identified questions
Statistical languages like SPSS, SAS, and R are typically used to deploy the various types of univariate techniques. It is also done through other languages common in data analytics and data science like Python. Spreadsheets like MS Excel are commonly used for fundamental univariate analysis involving limited data. However, before you start using any of these tools, you must understand the basic concepts of what is a dataset, specifically the types of columns that form a dataset. This is essential to know because different univariate analysis techniques are used for different types of variables.
What is Univariate data?
A dataset (also known as a feature set or simply a table) is a multidimensional heterogeneous data structure. It is formed by combining multiple one-dimensional data structures that are homogeneous.
For example, a dataset can have multiple columns such as ‘Employee Number’, ‘Name’, ‘Income’, ‘No. of Family Members’, ‘Date of Birth’, ‘Location’, ‘Designation’. These variables can have different data types such as text, number, logical, date, etc. However, univariate data works differently.
The univariate data is not categorized by data type but rather by the purpose they serve or their nature.
In this sense, univariate data (i.e., a single column) can be divided into ID, Numerical, and Categorical. This classification is essential because different types of univariate analysis are required for each type.
To understand univariate data and its classifications, first, follow the dataset below.
| Employee No. | Name | Income | No. of Family Members | DOB | Location | Designation |
|---|---|---|---|---|---|---|
| 1 | Alex | $21,060 | 3 | 12/01/1984 | NY | Sr. Manager |
| 2 | Mate | $59,879.95 | 2 | 31/08/1990 | LA | CEO |
| 3 | Philip | $30,126.30 | 1 | 01/07/1985 | LA | Co-founder |
| 4 | Lucy | $19,898 | 3 | 09/11/1986 | NY | Accountant |
| 5 | Rez | $47,876 | 3 | 10/10/1990 | NY | Sr. Analyst |
Univariate data classifications are as follows:
- ID: This data has no statistical or aggregative properties, and they are used to identify a subject uniquely. For example, the column ‘Employee Number’.
- Numerical (Quantitative): This data has statistical properties. They can be of two types- Discrete and Continuous.
- Discrete: This dataset has discrete values (i.e., cannot have decimals). For example- ‘No of Family Members.
- Continuous: This dataset can have numbers with decimals. For example- ‘Income’.
- Categorical (Qualitative): Categorical data deals with descriptions or categories. They have aggregative properties and are of two types- Ordinal and Nominal. (Note- categorical univariate data can have numeric datatype)
- Ordinal: These categories have an order. For example- ‘Designation’ where the order can be Manager, Sr Manager, CEO and cannot be any other.
- Nominal: These categories do not have any order. For example- ‘Location’ has mutually exclusive categories.
Typically, a univariate is data that belongs to any of the types mentioned above. Now, to analyze such a dataset, different types of univariate analysis techniques are used depending on the type of variable in question.
Types of Univariate Analysis
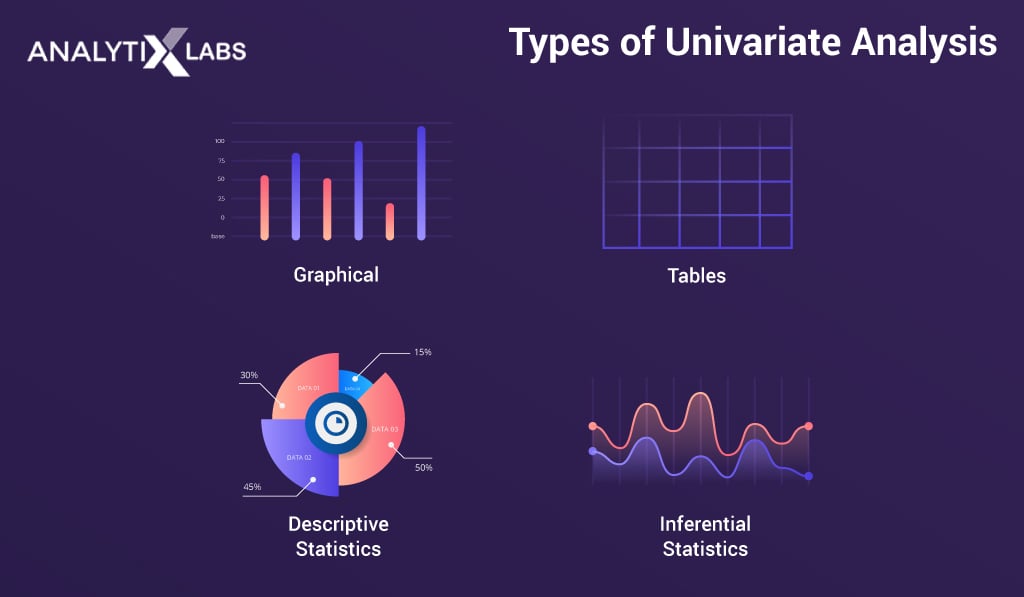
The primary purpose of univariate analysis is to describe data. Using different techniques, these descriptions are found. These techniques can be categorized into the following groups:
- Graphical
- Tables
- Descriptive statistics
- Inferential statistics (i.e., use of frequency distributions)
Each of these techniques provides information about the data in a unique way. Typically, a data analyst uses more than one technique to form their opinion about the data they are dealing with, as this helps them make important decisions related to data preparation. Let’s understand each technique.
Graphical analysis
Various types of graphs can be used to understand data. The standard type of graphs include-
- Histograms: A histogram displays the frequency of each value or group of values (bins) in numerical data. This helps in understanding how the values are distributed.
- Boxplot: A boxplot provides several important information such as minimum, maximum, median, 1st, and 3rd quartiles. It is beneficial in identifying outliers in the data.
- Density Curve: The density curve helps in understanding the shape of the data’s distribution. It helps answer questions such as if the data is bimodal, normally distributed, skewed, etc.
- Bar Chart: Bar Charts, mainly frequency bar charts, is a univariate chart used to find the frequency of the different categories of categorical data.
- Pie Chart: Frequency Pie charts convey similar information to bar charts. The difference is that they have a circular formation with each slice indicating the share of each category in the data.
Univariate tables
Tables help in univariate analysis and are typically used with categorical data or numerical data with limited cardinality. Different types of tables include:
- Frequency Tables: Each unique value and its respective frequency in the data is shown through a table. Thus, it summarizes the frequency the way a histogram, frequency bar, or pie chart does but in a tabular manner.
- Grouped Tables: Rather than finding the count of each unique value, the values are binned or grouped, and the frequency of each group is reflected in the table. It is typically used for numerical data with high cardinality.
- Percentage (Proportion) Tables: Rather than showing the frequency of the unique values (or groups), such a table shows their proportion in the data (in percentage).
- Cumulative Proportion Tables: It is similar to the proportion table, with the difference being that the proportion is shown cumulatively. It is typically used with binned data having a distinct order (or with categorical ordinal data).
In some instances, all such univariate tables can be used as an alternative to a more graph-based way of describing the analysis.
Univariate Statistics
Univariate analysis can be performed in a statistical setting. Two types of statistics can be used here- Descriptive and Inferential.

Descriptive Statistics
As the name suggests, descriptive statistics are used to describe data. The statistics used here are commonly referred to as summary statistics.
For instance, if you have to describe a cube, you have to ‘measure’ it. By measuring its length, breadth, and height, you can describe it. Similarly, these descriptive or univariate statistics have specific measures that help us in describing the data. These measures are-
- Measure of Central Tendency: Statistics such as mean, median, and mode are considered here. They help in summarizing all the data through a single central value.
- Measure of Variability: Analysts also need to understand how the data varies from the central point. To understand this, specific univariate statistics can be calculated, such as range, interquartile range, variance, standard deviation, etc.
- Measure of Shape: The shape of the data distribution can explain a great deal about the data as the shape can help in identifying the type of distribution followed by the data. Each of these distributions has specific properties that can be used to your advantage. By analyzing the shapes, you will know if the data is symmetrical, non-symmetrical, left or right-skewed, is suffering from positive or negative kurtosis, among other things.
These descriptive statistics can be used for calculating things like missing value proportions, upper and lower limits for outliers, level of variance through the coefficient of variance, etc.
Inferential Statistics
Often, the data you are dealing with is a subset (sample) of the complete data (population). Thus, the common question here is –
Can the findings of the sample be extrapolated to the population? i.e., Is the sample representative of the population, or has the population changed? Such questions are answered using specific hypothesis tests designed to deal with such univariate data-based problems.
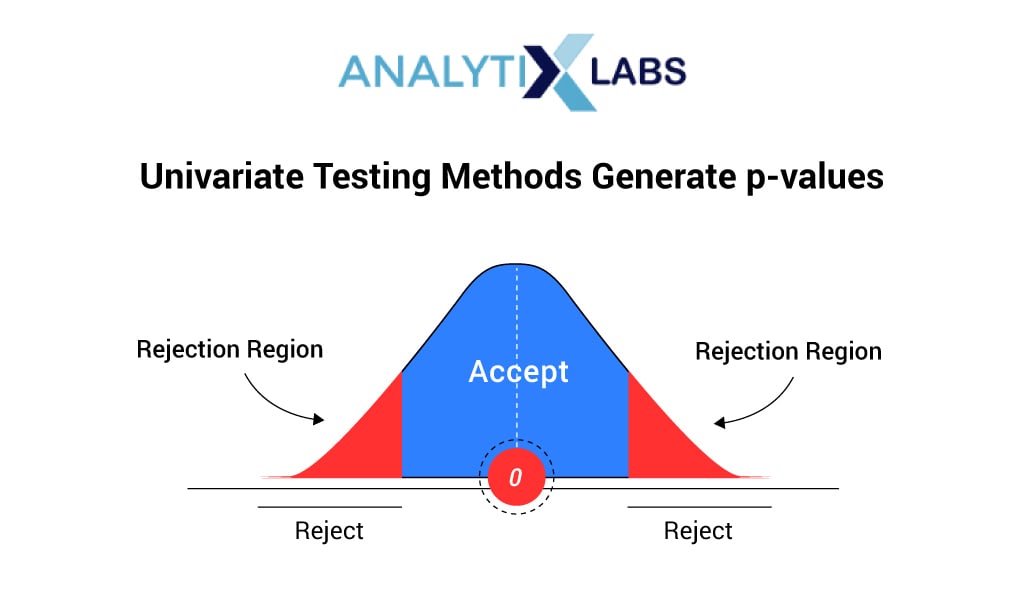
Hypothesis tests help us answer crucial questions about the data and their relation with the population from where they are drawn. Several hypotheses or univariate testing mechanisms come in handy here, such as-

- Z Test: Used for numerical (quantitative) data where the sample size is greater than 30 and the population’s standard deviation is known.
- One-Sample t-Test: Used for numerical (quantitative) data where the sample size is less than 30 or the population’s standard deviation is unknown.
- Chi-Square Test: Used with ordinal categorical data
- Kolmogorov-Smirnov Test: Used with nominal categorical data
All such univariate testing methods generate p-values that can be used to accept or reject different types of hypotheses.
In real-time, all these techniques are used depending upon the situation, type of data, and problem statement.
Univariate Analysis Examples
While there can be hundreds of univariate analysis examples where univariate analysis is used, some of them are-
- Finding the average height of a country’s men from a sample.
- Calculate how reliable a batsman is by calculating the variance of their runs.
- Finding which country is the most frequent in winning Olympic Gold Medal by creating a frequency bar chart or frequency table.
- Understanding the income distribution of a county by analyzing the distribution’s shape. A right-skewed distribution can indicate an unequal society.
- Checking if the price of sugar has statistically significantly risen from the generally accepted price by using sample survey data. Hypothesis tests such as the Z or t-test solve such questions.
- Assessing the predictive capability of a variable by calculating the coefficient of variance.
Bi-variate and Multi-variate Analysis
- Bivariate Analysis: Bivariate analysis is performed when two variables are involved. Here, you typically try to understand how two variables affect each other, how they are related, or how they compare to each other. Like univariate analysis that is performed through graphs, tables, and statistics, bivariate analysis can also be performed somewhat similarly. For example- scatterplots, bar charts, pie charts, multi-line charts, cross-frequency tables, and tests such as dependent t-test, independent t-test, and one-way ANOVA are used for bivariate analysis.
- Multivariate Analysis: So far we have discussed the analysis of single variables. However, when more than two variables are to be analyzed, such an analysis is called multivariate analysis. Typically, predictive problems are solved under such an analysis where many variables are used to predict another variable. However, non-predictive analysis is also performed by creating a correlation matrix, cross-frequency tables, dodged or stacked bar charts, etc.
This brings us to the end of understanding what univariate analysis is, the techniques and methodologies. Below are a few commonly asked questions that can help you get more clarity on this [more like a recapitulation]. If you have more questions, do let us know in the comments below.
Univariate Analysis: FAQs
1. What is the use of Univariate analysis?
It is used to:
- Describe/summarize
- Find patterns
- Data preparation such as missing value imputation, outlier treatment, feature reduction, feature transformation, normalization, scaling, etc.
2. How do you analyze univariate data?
There are multiple ways to describe data. This includes creating and using graphs, tables, descriptive statistics, hypothesis tests, etc., using spreadsheets, statistical, or programming languages.
You may also like to read: