Modern businesses are using data to profitably streamline business functions, including operations, marketing, sales, and customer retention, to boost overall revenue. However, the biggest challenge lies in processing big data, encompassing – both structured and unstructured data sets. Here, the AI-based technology – anomaly detection, serves as the mainspring to cope with it.
Data is growing in volume and complexity owing to the exponential development of real-time applications. It is nearly impossible to manually clean, process, analyze, and derive insights from such an enormous database along with 360-degree data security.
Therefore, proactively detecting anomalies (abnormalities) during the data in motion is of utmost importance. Its prominent use cases are as follows –
- Data Cleaning
- Image Processing
- Fraud and Intrusion Detection
- Threshold-Based Detection in Sensor Networks
- Health Monitoring
- Financial Transactions and Banking Applications
- Ecosystem Turbulences
- IT and Cyber Security
In this guide, we will discuss what is anomaly detection, how to study anomalous data, anomaly detection models, and anomaly examples.
What is an Anomaly?
Generally, an anomaly is an abnormality, irregularity, divergence, or non-classifiable element from the set pattern/group, standard, and prediction . For a better understanding, here are some simple anomaly examples –
- A fountain pen in the set of ballpoint pens – fountain pen is an anomaly.
- Split AC in the department of Windows AC – Split AC is an anomaly.
- iPhone with the smartphones of Samsung Brand – iPhone is an anomaly.
From the business perspective, an unexpected change or rare occurrence of an event that sounds suspicious is an anomaly.
For example, when a person does an international transaction for the first time. The concerned bank holds it and blocks the card until successful authentication. The system triggers an alert for such a transaction, as it is different from the customer’s spending behavior.
Other anomaly examples can be –
- Multiple failed attempts during logging into any application
- Fraudulent banking transactions, tax returns, or insurance claims
- Violation of the school, college, or office network infrastructure policies
Therefore, constant and automated real-time monitoring is crucial to save business resources and reduce data vulnerability.
In the subsequent sections, we will study how anomaly detection in Machine Learning resolves the emerging challenges of big data.
What is Anomaly Detection (AD)?
It is a process of detecting anomalies in the data sets. It works upon chaos engineering to identify the root cause of the abnormality . Modern businesses utilize it to minimize risk factors, improve communication, and enable real-time anomaly monitoring.
The traditional abnormal detection techniques are manual and a pretty daunting task. However, with Machine Learning, it has become quite successful in today’s fast-paced technology of distributed systems –
- Superior Performance
- Extensively Adaptable
- Time Efficient
- Effortlessly Handles Big Data
Anomaly detection uses three distinctive approaches –
1. Supervised
In this abnormal detection approach, the training data set constitutes two categories of labeled items – normal and abnormal.
This labeling requires much preparation and manual work before real-time implementation and A/B testing.
The data set quality and the classifier’s efficiency matter greatly here, as it undergoes a typical classification to identify abnormalities. Further, the model uses these final samples to extract, process, and analyze the data patterns.
The approach is the same as that of traditional pattern recognition. However, the detection works by capturing the variances between the classes.
The prominent supervised anomaly detection algorithms are –
- Decision trees
- Bayesian Networks
- Support Vector Machine (SVM)
- K-Nearest Neighbors (KNN)
2. Unsupervised
Unlike supervised, it is straightforward and doesn’t include the challenging task of manually labeling the training data set.
The entire process is flexible and works on the presumption that the provided data set has normally labeled items.
It evaluates the training data set based on predefined natural features. The items which diverge from the normal behavior are flagged as anomalous data.
This approach also includes the Density Estimation Approach for a high-precision result-
- Gaussian Mixture Models (GMMs)
- Kernel DEA
- Isolation Forest (IFOR)
- Lightweight Online Detector of Anomalies (LODA)
Notably, ML engineers highly prefer the unsupervised abnormal detection approach and find it best suitable for real-life data. The most popular anomaly detection algorithms are –
- Autoencoders
- Hypothesis Tests-Based Analysis
- K-means
- C-means
- One Class Support Vector Machine
- Artificial Neural Networks (ANN)
- Principal Component Analysis (PCA)
- Self-Organizing Maps (SOM)
- Expectation-Maximization Meta-Algorithm (EM)
- Adaptive Resonance Theory (ART)
3. Semi-Supervised
Semi-supervised abnormal detection approach is a combination of the above two. By utilizing both, the model detects the precise anomalous data and the underlying causes of occurrence. It constantly A/B tests and allows for real-time anomaly monitoring plus control of the patterns the model learns.
Time Series Data Anomaly Detection
The time series data is the record of timestamps and data measured at that particular time. This anomaly detection approach utilizes these time series records to discover actionable signals and abnormalities within the key KPIs.
It is beneficial to forecast and derive accurate results for the following types of metrics –
- Daily active users on any platform
- Total web page views and Bounce rate
- Cumulative mobile app installs
- Churn rate, Cost per lead, and Cost per click
- The volume of transactions and average order value
Types of Time Series Anomalies
1. Global or Point-based
It is a rare occurrence of an event where one data point differs from all other data points. This means the particular data point is an anomaly and is off the wall from the entire data set.
For example –
Your bank deducts the consolidated service charges every year as INR 120 per month. But from the middle of the year, it starts charging an additional INR 50 per month without any announcement. It is an anomaly case for the bank’s transaction division.
2. Contextual or Condition-based
In this type, the abnormal data point differs from other data points in a defined condition of the data set. It may not be an anomaly in different periodic contexts.
For example –
An eCommerce store gets huge sales during the festival and holiday seasons as it offers the biggest discounts. However, after the off-season, the store still witnesses significant sales, which is unusual. It is an anomaly for the store’s price and inventory management and may incur a loss.
3. Collective-based
In this type, the subset of data points differs from the entire data set. The individual data point is neither globally nor contextually abnormal. However, the subset becomes anomalous when combined with other time series data sets.
For example –
Post-pandemic, all eCommerce marketplaces are growing exponentially. So if any of them witnesses a decline in sales, it is a global anomaly.
But if all eCommerce marketplace starts seeing a drop in apparel & accessories sales during peak season, it is a collective anomaly in the product category.
Anomaly Detection Methods
Density-based techniques
Density-based techniques are specifically used for the data space’s dense locales. These are distinguished by diverse regions of lesser item density. These are ineffective as data dimensionality grows.
As data points are distributed throughout a wide volume, their density falls owing to the fate of dimensionality. It renders the appropriate collection of data points more difficult to identify. These approaches are broadly categorized into two types:
- k-nearest neighbor: It is a lazy, non-parametric learning technique. It is used to categorize data based on distance measures.
- Relative Density of Data: This technique uses the distance metric concept known as reachability distance.
Cluster-Analysis based techniques
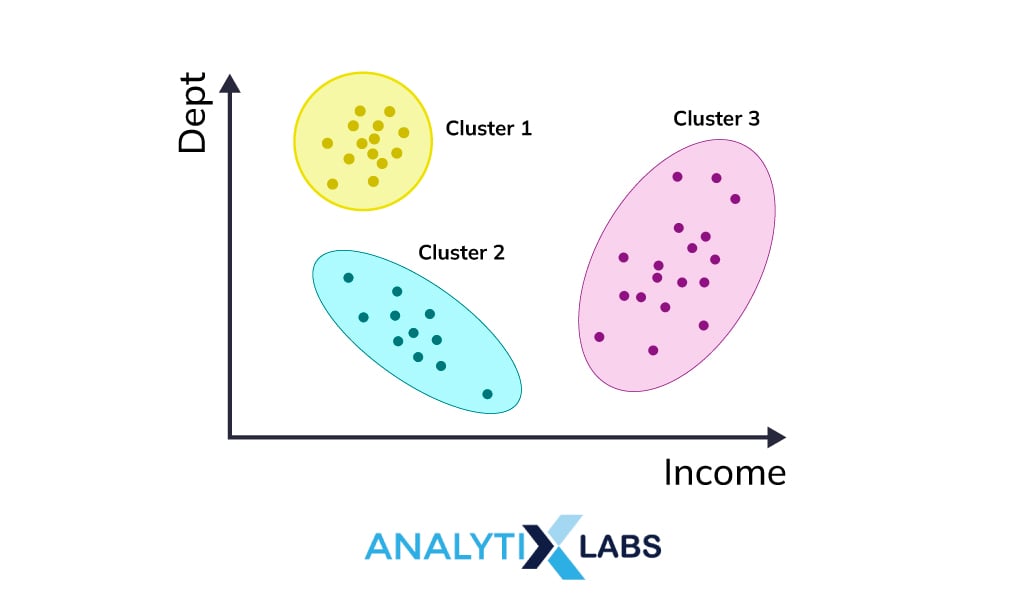
Cluster analysis is mainly used in the zone of unsupervised learning. This technique involves clustering data points by using a K-means algorithm in the system. The K-algorithm typically creates “K” alike clusters of data points.
However, there will be some data that will fall outside of these K groups. Such data instances are categorized as anomalies. The outcomes of these clustering techniques are easily interpretable and the data are quite easily understandable.
Moreover, due to the colossal amount of data and vast databases, the clustering algorithm must be scalable, otherwise, it would be very hard to get appropriate results.
Bayesian Networks
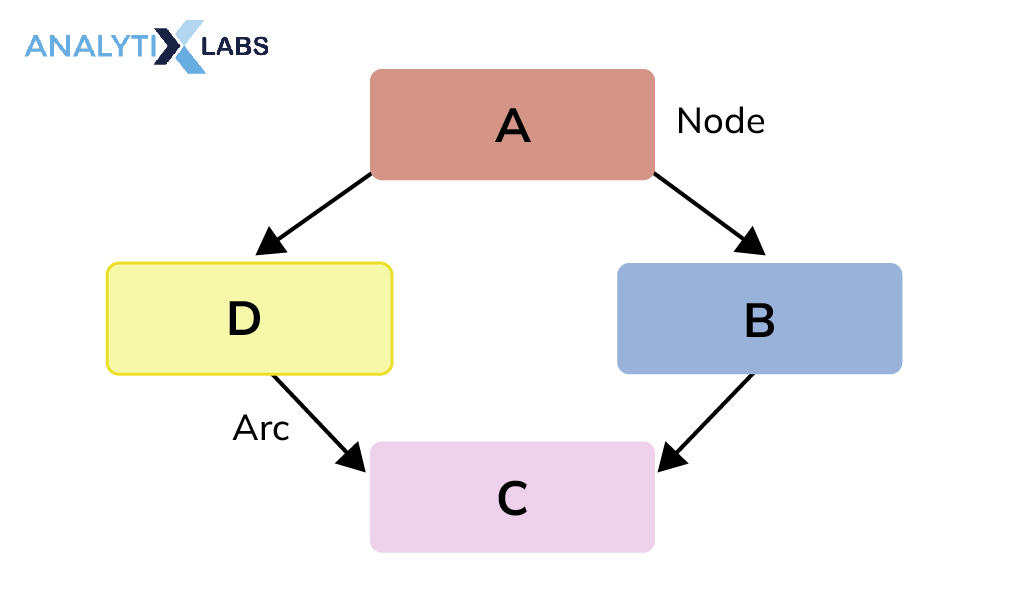
The Bayesian Networks are mostly used when there are some uncertain domains associated. It mainly represents those uncertain domains in a probabilistic graphical model where each node represents a distinct variable and every edge reflects the transition probabilities for the related random variables.
A BN is a directed acyclic graph (DAG) with no loops or self-connections because of dependencies and conditional probability. Now, the question arises, why the BN is probabilistic in nature?
Well, these networks are formed from a probability distribution and use probability theory to anticipate and identify anomalies. It is also referred to as the Bayes network, decision network, or belief network as well.
Neural Networks, Autoencoders, LSTM networks
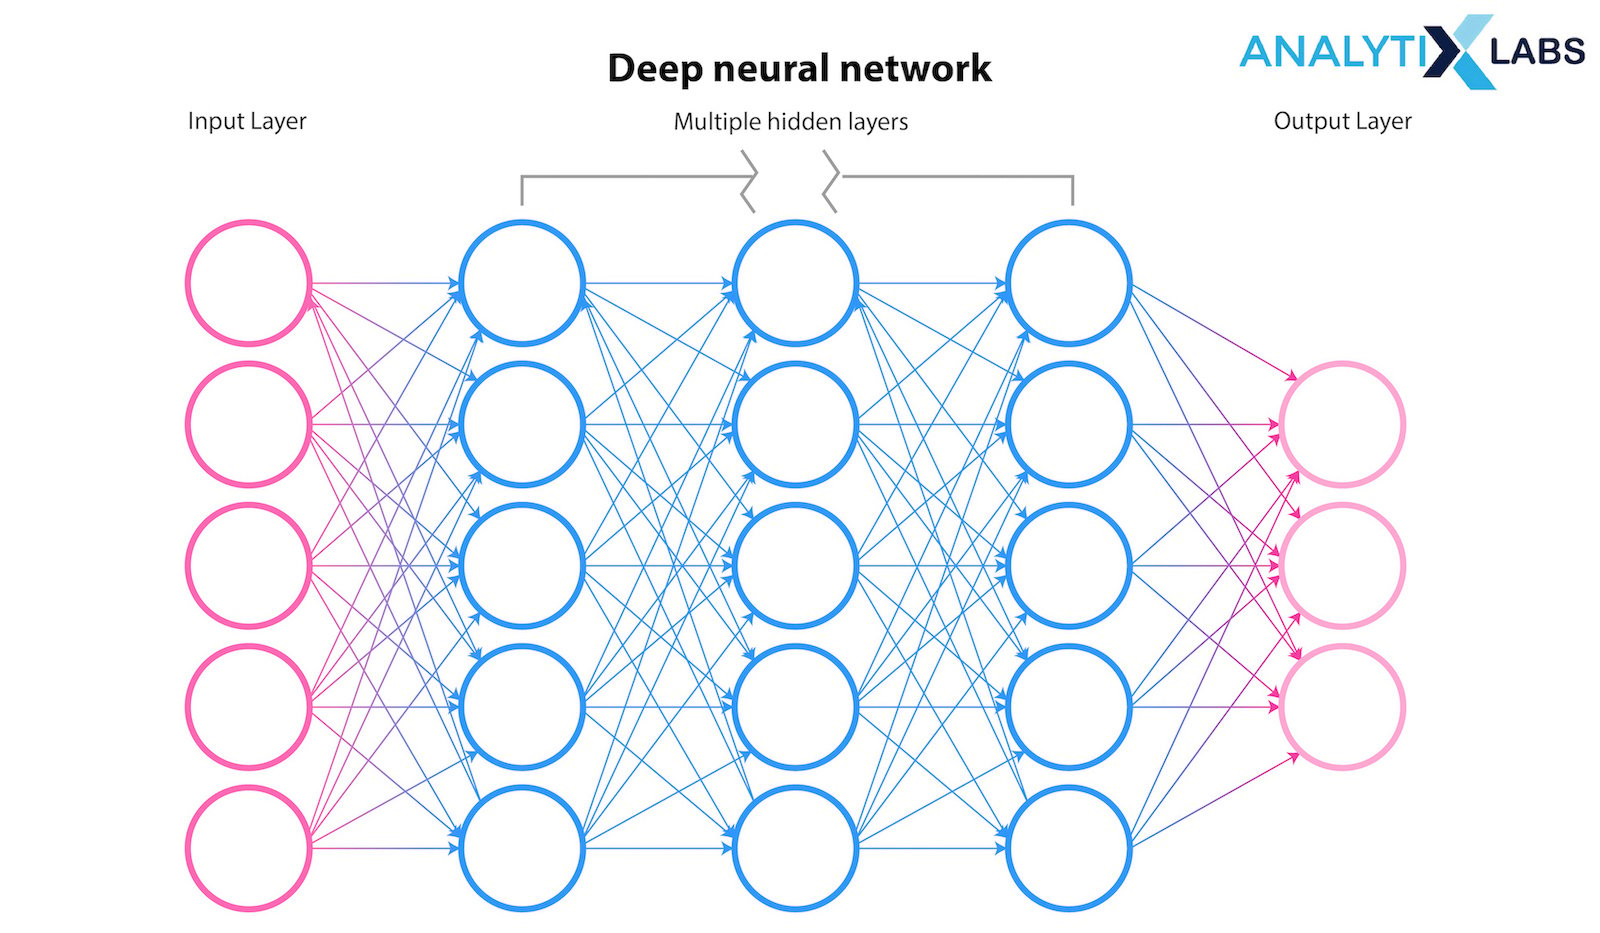
Neural Networks are a type of machine learning that forms the basis for deep learning approaches. Interestingly, this network functions as the human brain, helping computer programs in the domains of Artificial Intelligence, deep learning, and machine learning to discover patterns and solve common issues.
Also Read: Understanding Perceptron: The Founding Element of Neural Networks
Autoencoders are typically used for removing various noises from the data. It is a form of neural network that has the capability of copying its input to its output.
Due to their ability to understand long-term connections between data time steps, LSTMs are primarily used to learn, analyze, and categorize sequential data.
Support Vector Machines
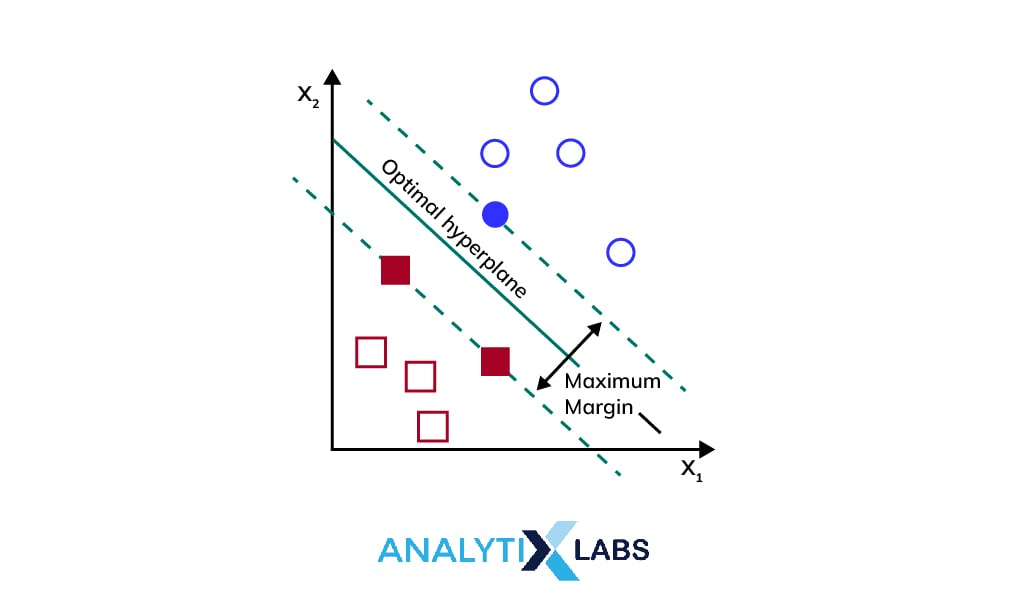
A linear model called Support Vector Machine (SVM) is employed to address classification and regression problems. It can resolve both linear as well as non-linear problems and is effective for a variety of real-world challenges.
The support vector machine method seeks a hyperplane in N-dimensional space (where N refers to the number of features) that categorizes the data points unambiguously. SVM is divided into two types: Simple SVM and Kernel SVM.
Simple SVM is mainly used in linear classification and regression issues, whereas Kernel SVM is mainly used for non-linear data.
Hidden Markov Models
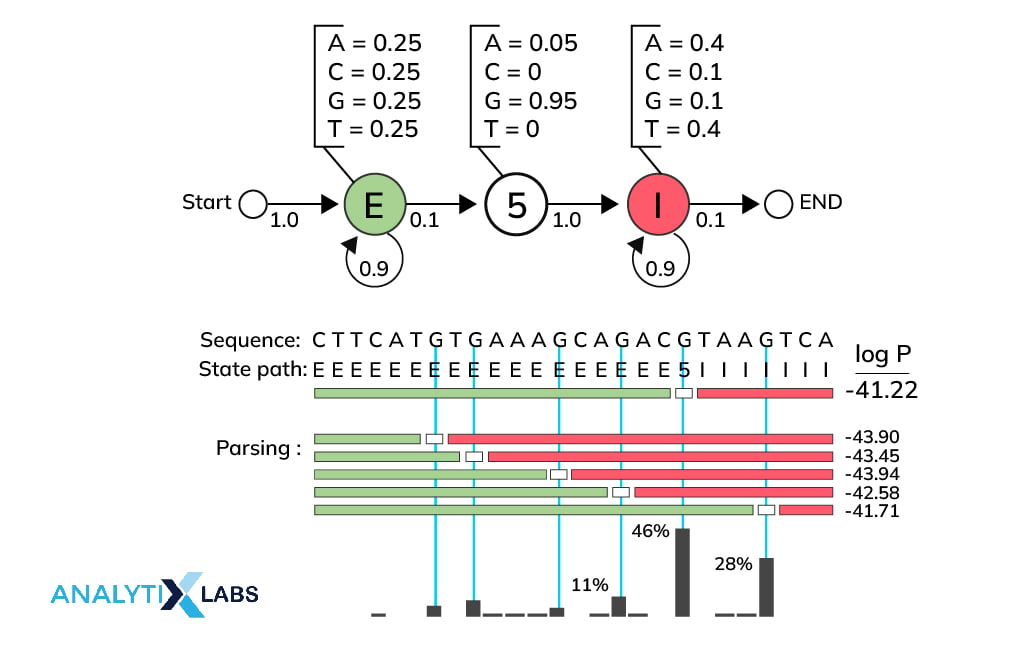
The Hidden Markov model (HMM) is a statistical framework designed by Baum L.E. (Baum and Petrie, 1966) that employs a Markov process with hidden and unknown parameters.
The observable parameters are developed to determine the hidden variables in this model. These variables are then employed in additional analysis. A Markov chain is a form of HMM.
Its condition cannot be directly viewed, but the vector series may be used to identify it. Moreover, it is a graphical model with probabilistic properties that are extensively used in statistical pattern detection and classification.
It is an effective technique for identifying weak signals and has been used successfully in temporal pattern recognition applications such as voice, and handwriting.
Fuzzy logic-based outlier detection
The strategy addresses issues from the standpoint of horizontal and vertical consistency. The approach was used to help with data input in a cohort system that collects data. The proposed technique was found to detect probable mistakes during data entry in the pilot research.
This detection model is principally developed for finding specific resolutions for the PEP (Performance Evolution Problems). The fuzzy logic method examines the performance index associated with the set of metrics.
Univariate Anomaly Detection
One of the major use of the Anomaly Detector API is to keep track of and detect the abnormalities present in your time series data. You do not necessarily have to learn machine language for pursuing this process, however, some knowledge of ML would surely be helpful. No matter your business, scenario, or data volume, the Anomaly Detector API can find the best-fitting models for your data and apply them automatically.
The API uses your time series data to establish anomaly detection thresholds, typical values, and outliers. If you do not have any prior training in machine learning, you can still use the Anomaly Detector. The REST API makes it possible for you to effortlessly incorporate the services into your apps and procedures.
Univariate Anomaly Detection on Sales
The IsolationForest technique, used by the IsolationForest algorithm to discover outliers, relies on the observation that anomalies are represented by a small number of statistically significant data points.
To put it simply, the Isolation Forest model is a forest of trees. By picking a feature at random and then picking a randomized split value between both the feature’s minimum and maximum, these trees can generate useful partitions with little to no bias.
- Trained IsolationForest on Sales data.
- Store Sales in NumPy to use in models.
- Scored each observation for abnormality. The input sample’s anomaly score is the forest’s mean.
- Each observation was an outlier or not.
- The visualization shows outlier areas.
Take a look at how iForest technique helps in discovering outliers.
Univariate Anomaly Detection on Profit
- Isolation Forest was trained using the Profit input.
- Put the money made into a NumPy array so it may be used in the forecasting tools later.
- Tallied up each observation’s anomaly score. The anomaly score of a given input sample is found by averaging the scores of individual trees in the forest.
- Designated each data point as either an outlier or a non-outlier.
- The image draws attention to the areas where the outliers are located.
Multivariate Anomaly Detection
Further empowering developers is the availability of multivariate anomaly detection APIs, which make it simple to use cutting-edge AI for spotting outliers across collections of metrics without specialized machine learning expertise or labeled training sets.
It can consider up to 300 possible signal dependencies and intercorrelations automatically. Complex system failures can now be avoided before they even happen.
This is useful for protecting critical data as well as critical infrastructures such as computers, factories, spaceships, and businesses.
Multivariate Anomaly detection involves the following steps:
1. Constructing a Data Set
Both training and inference data need to be ready before beginning data preparation. When it comes to training data, you will want to save your files to Blob Storage and then create SAS URL for usage in the training API. If you want to transmit inference data, you may either use the same format as training data or put it in the API header, in which case it will be converted to JSON.
2. Training
In order to train a model, you must first make a call to an asynchronous API on the training data, otherwise, you will not be able to check on the model’s progress until you make a separate API request.
3. Inference
In inference, you may use an asynchronous or synchronous API. To batch validate, utilize the asynchronous API. Use the synchronous API if you wish to stream with a small granularity and obtain the inference result after each API call.
With the asynchronous API, you will not obtain the inference result instantly, like with training, therefore you must use another API to retrieve the result after some time. Data prep is like training.
In synchronized API, you may retrieve the inference results immediately after requesting, and you should give JSON data to the API body.
Cluster-based Local Outlier Factor (CBLOF)
The outlier score is determined by the CBLOF using the cluster-based local outlier factor as the determining factor. Calculating an anomaly score involves multiplying the distance from each instance’s location to the center of its cluster by the number of instances that are a part of that particular cluster.
The CBLOF implementation is already included in the PyOD library. Segregating a shop’s customer list into new customers and existing customers serves as a perfect example of CBLOF.
There are four basic methodical approaches to clustering:
- Partition Methods
- Hierarchical Methods
- Density-based Methods
- Grid-Based Methods.
Also read: What is Clustering in Machine Learning: Types and Methods
Histogram-based Outlier Detection (HBOS)
HBOS operates on the assumption that the features are independent of one another and computes the degrees of anomalies by constructing histograms. When performing multivariate anomaly detection, a histogram is produced for each feature.
This histogram can then be graded independently before being merged in the final step. When utilizing the PyOD library, the code is quite identical to that of the CBLOF. Using this strategy, outlier data points across numerous variables may be analyzed.
HBOS is a helpful unsupervised approach for spotting outliers, as histograms are easy to generate.Why does your company need anomaly detection?
No matter how many metrics a modern organization may keep tabs on, anomaly detection is essential for providing reliable, real-time information. The requirement for teams of analysts to sift through massive volumes of data can be mitigated by an automated anomaly detection system, which will include the detection, sorting, and grouping of data.
For instance, Waze, an AI-based navigation and traffic app, is now powered by Anodot’s autonomous analytics system to detect and react to user-reported anomalies and problems.
Such applications are finding a way into the business that can enable end users to report abnormalities in real-time for the AI tool to learn and adapt quickly.
-
Anomaly Detection for Product Managers
Product managers cannot rely on other departments for monitoring and notifications. Instead, they must be able to rely on the product from the first deployment to each new feature.
Every time you roll out a new version of your product, do an A/B test, add a new feature, modify your sales funnel, or expand your customer support team, there is a chance for unexpected behavior to arise.
The inability to detect these product irregularities and anomalies can result in millions of dollars in lost income and irreparable harm to your brand’s reputation if not addressed quickly.
Moreover, releasing a faulty version of the software or regularly failing at customer support leads to less usage from clients.
Proactively simplifying and enhancing user experiences boosts customer satisfaction. It is applicable across various sectors, including gaming, where anomaly detection plays a major role in fixing bugs and glitches and augments user experience.
FAQs
1. What is anomaly detection used for?
Anomaly detection identifies abnormalities in the data set based on pre-defined natural features, events, learnings, and observations. It seamlessly monitors vulnerable data sources like user devices, networks, servers, and logs. Some of the popular uses cases are as follows –
- Behavioral Analysis
- Data Loss Prevention (DLP)
- Malware Detection
- Medical Diagnosis (Used along with Deep Learning)
- Unusual Activities on Social Media Platforms
- Unauthorized or Suspicious Login Attempts
- IoT and Big Data Systems (Mainly in Analytics and Security)
- Live Monitoring and Video Surveillance
- Fault Detection in Manufacturing Units
- Examine sensor readings in an aircraft
2. What is an anomaly detection example?
There are many examples of anomaly detection however, the most common in the business world are as follows:
- Alarming critical incidents in financial transactions
- Detecting unexpected technical glitches (intentional/unintentional)
- Determining potential opportunities and locations of data vulnerabilities
- Observing change in consumer behavior
- Indicating defects in medical scanners
- Mapping anomalous locations in geographic data
- Monitoring in Real-time GPS-based streaming data (Trajectory Streams)
- Content-based Anomaly Detection on OTT Platforms and News Media
3. What is anomaly detection in AI?
Anomaly Detection in AI best supports dynamic environments –
- Automatically detects the abnormalities in the ecosystem utilizing advanced multi-dimensional baselining capabilities.
- In the first place, it prioritizes problems as per the current computing scenario. Thereafter classifies them by evaluating the impact of abnormalities detected in the real-time applications.
- Efficiently interconnects the related performance concerns and auto sends alerts to fix the root cause problems. This becomes largely manageable for the operating team and much more solution-oriented.
4. Which model is best for anomaly detection?
There are several anomaly detection models and their usage depends on the purpose and outcome expected from the anomaly detection model.
However, Support Vector Machine (SVM), Isolation Forest, and Neural Networks are the first preference in anomaly detection algorithms.
5. How is anomaly detection different from classification?
Anomaly detection is different from classification because the prime goal of classification is to categorize the data into two or more classes based on the learned observations. Classification completely works on supervised learning fundamentals and uses a balanced data set.
Unlike an anomaly, the classification does not detect anything abnormal. On the contrary, anomaly detection characterizes data as normal and anomalous data. It applies all three supervised, unsupervised, and semi-supervised learnings on the training and testing data sets to generate accurate results.
6. Why is anomaly monitoring useful?
Anomaly Monitoring significantly contributes to identifying, monitoring, and analyzing the root causes of the anomaly detected. A single instance of negligence can incur considerable business risk. This is where real-time supervision is essential to take proactive actions immediately and prevent dreadful outcomes.
In addition, it addresses the two critical operational constraints in business –
- The well-constructed evidence-based behavioral models only extract data behavior. Here, the integration of anomaly detection with these models determines anomalous data and supports predictive analytics.
- The static alerts and associated thresholds are not entirely capable of identifying outliers. As a result, there is the highest probability of overlooking data breaches and potential threats.
Notably, anomaly monitoring with Machine Learning is exceptionally powerful in forecasting failures and unseen degradation possibilities.



1 Comment
Nice Post.Thanks for sharing