Business problems have evolved to become more complex. As a result, more complex, varied, and new machine learning algorithms have found a place in the present date. A data scientist masters more than a dozen machine learning algorithms, including the most widely used ones like Decision trees, Naive Bayes, and Support Vector Machines. In this article, we will look into one such algorithm – the KNN algorithm in machine learning.
KNN algorithm in machine learning is a parametric and distance-based algorithm that works in a supervised learning setup that can solve regression and classification problems by creating non-linear decision boundaries capable of solving complex problems.
To understand the KNN algorithm, you must first be clear about various aspects of machine learning.
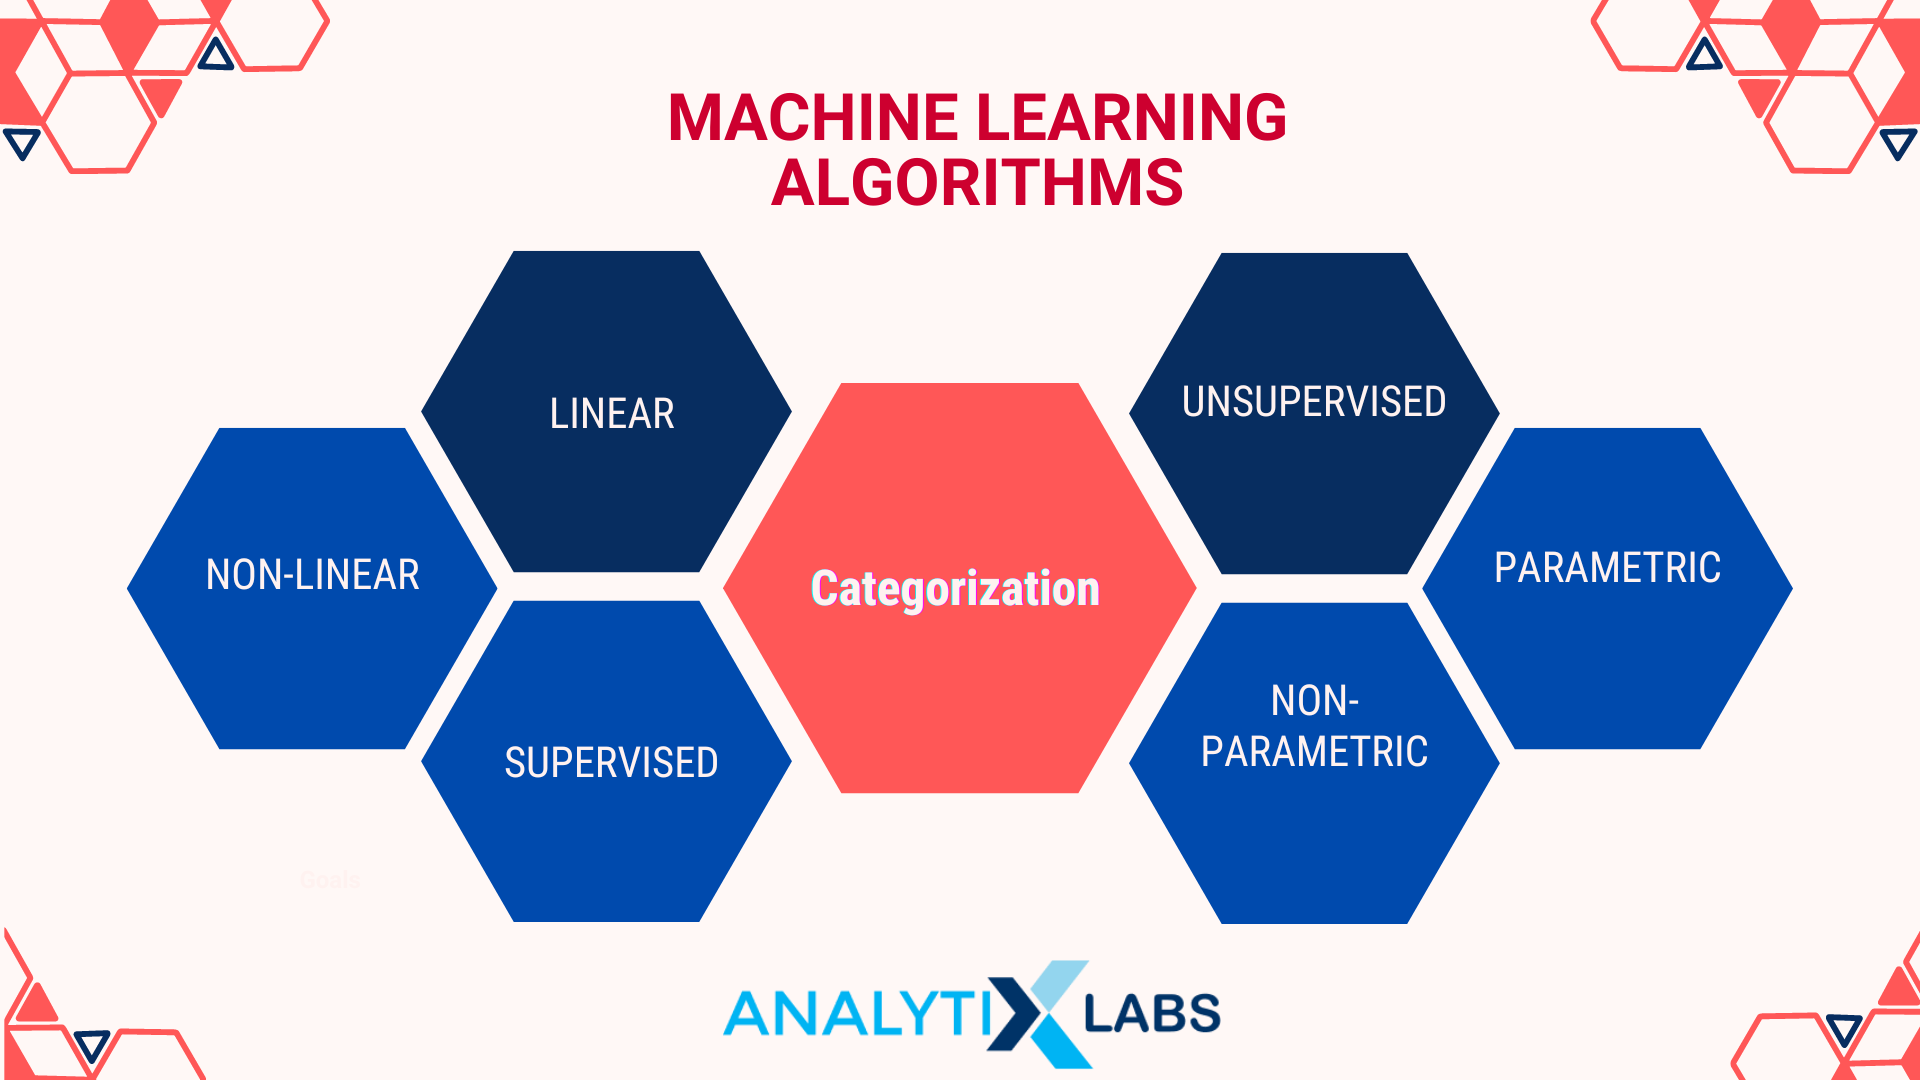
Machine Learning Algorithms – Categorization
Machine Learning algorithms are categorized as follows:
-
Linear vs. Non-Linear
Specific algorithms come up with a linear decision boundary. A linear mathematical equation is typically used to come up with an answer. Examples are Linear Regression and Logistic Regression.
On the contrary, some algorithms can create a non-linear decision boundary which is particularly helpful when solving complex problems. Decision Trees and Random Forest are examples of such non-linear algorithms.
-
Supervised vs. Unsupervised
Specific algorithms require the ground truth (also known as the y or dependent variable). The algorithm then uses the predictors (also known as the x or independent variables) to understand their connection. These are the supervised algorithms.
An algorithm that doesn’t require a y variable and works on pattern detection mechanisms is an unsupervised algorithm.
-
Parametric vs. Non-Parametric
Certain algorithms use complex statistics involving data distribution and strict assumptions to work. Such algorithms are called parametric algorithms.
Those not relying on such assumptions and distribution are known as non-parametric.
Also Read: Parametric vs. Non-Parametric Tests
All the business problems solved by my ML algorithms can be broadly categorized into:
- Regression: Where the dependent variable is numeric (continuous)
- Classification: The dependent variable is categorical
- Segmentation: There is no dependent variable
- Forecasting: The values are predicted by involving the time component
An ML algorithm can involve Bayesian statistics, frequentist statistics, distance-based equations, or complex mathematics involving calculus or linear algebra. The technique used by the algorithm dictates its very nature and its associated pros and cons.
Based on the brief about machine learning algorithms, it is now easier to define the KNN algorithm in machine learning.
KNN Algorithm in Machine Learning: Definition
KNN stands for K Nearest Neighbor.
K refers to an undefined number of neighbors we have to find (as the accuracy of the KNN model in machine learning greatly depends on it).
In contrast, “Nearest Neighbor,” as the name suggests, refers to the closest data points i.e., neighbors from a new point in the data space.
To understand how the KNN algorithm in machine learning works, you must first understand KNN classifiers in machine learning and how they are used.
Below we will look at Classification problems and Regression problems, followed by their respective solutions.
Learn from AnalytixLabs
You can explore our Machine Learning course and also our certificate course in data science, or you can book a demo with us.
Classification Problem
One of the most common applications of the KNN algorithm in machine learning is to solve classification problems. To recapitulate, the classification problem here means that the dependent variables have categories, and you have to predict the class an observation belongs to by mapping the relationship of the independent variables with the dependent variable.
-
Visual understanding
The best way to explore KNN in machine learning is to start by visually understanding how a KNN classifier works (once understood, the concept can easily be extrapolated and modified to understand regression).
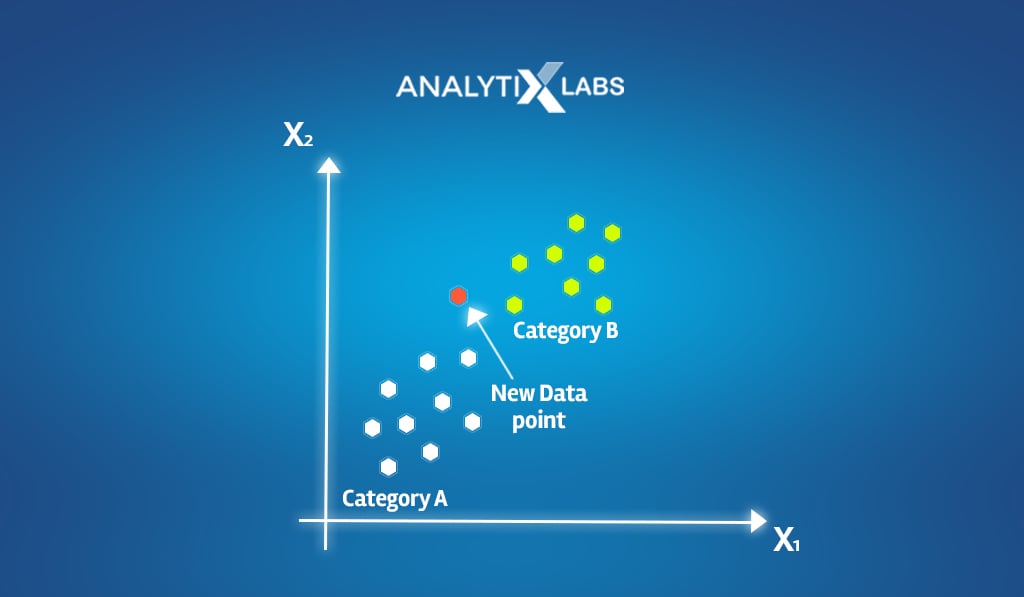
- Suppose a dataset has two categories (in the dependent variable)- Category A: White and Category B: Green.
- Let x1 be a new data point, and you are tasked with finding the category x1 belongs to. The idea behind KNN is to consider the K number of data points closest to x1 that we will refer to as neighbors from this point forward.
- Let’s consider K=5. The KNN model in machine learning will calculate the distance between the new data point x1 and all other data points.
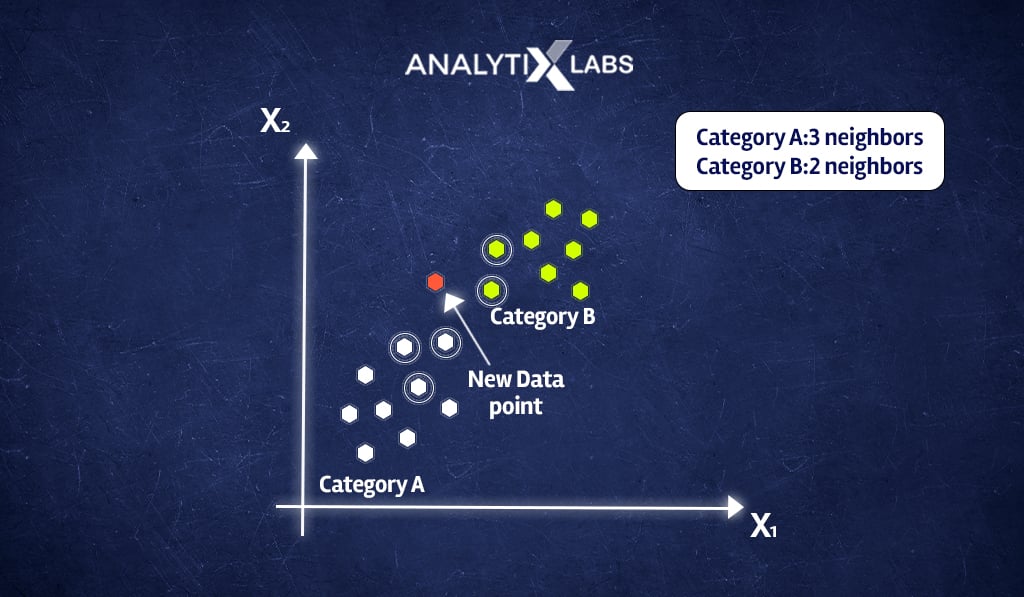
- The algorithm will then shortlist those 5 data points closest to x1 and analyze the associated classes of these 5 data points.
- In our example, as seen below, out of the five closest neighbors of the new data point x1, three belong to Category A: White, while only two belong to Category B: Green.
- Now we use the majority voting, and as the majority of classes closest to x1 is White, we predict that x1 belongs to Category A: White.
-
Mathematical understanding
Let’s now get a bit more practical and mathematical with the working of the KNN algorithm in machine learning. The idea of K closest neighbors needs to be calculated and quantified. To explore this, we take an example dataset and calculate the K nearest neighbor for a new observation.
Setting the example
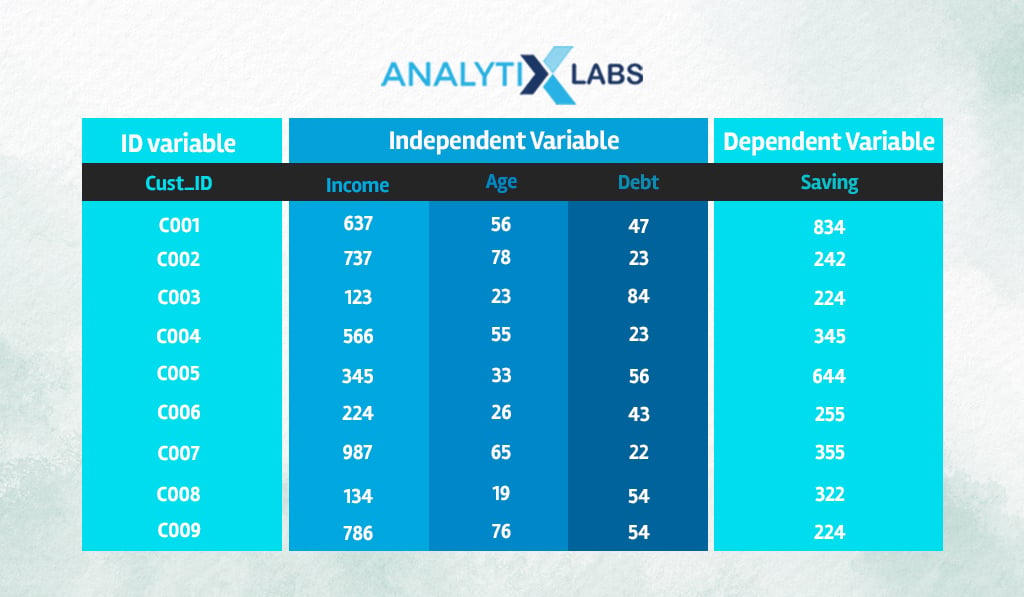
Suppose we have a dataset where we have the information of previous bank loan applicants, such as their Income, Age, and Debt (loan amount).
As K nearest neighbor is a supervised learning algorithm, it requires historical data with a dependent variable.
Here we consider knowing the Loan Status as the dependent variable, with 1 indicating a defaulter and 0 as a repayer.
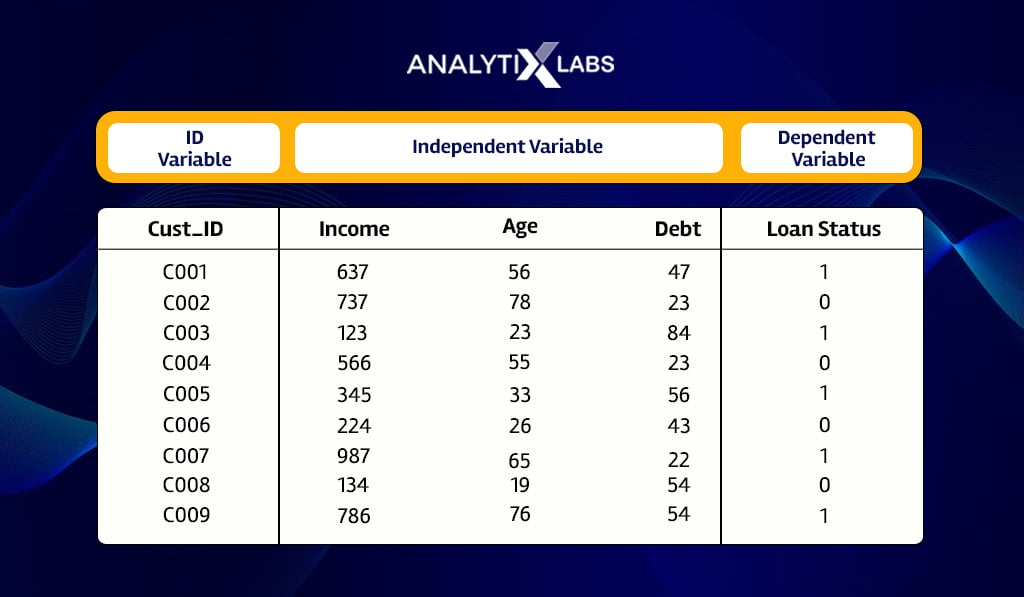
A new loan application is received with the following details-
| Customer ID | Income | Age | Debt |
|---|---|---|---|
| C_New | 643 | 31 | 65 |
If you plan to use KNN, the idea is that based on the historical data, we find the K closest neighbor to the new data point, analyze their classes, and based on that answer if this new applicant will default or not.
Here you must try to understand the idea behind it.
KNN is looking at this bank applicant, let’s call them ‘A’, and is looking at those historical applicants that have similar characteristics (in this case, similar Income, Age, Debt (loan amount)) and then based on their repayment outcome is deciding whether to grant ‘A’ a loan or not.
Therefore, if most of the applicants similar to ‘A’ could not pay the loan and defaulted, it is better to deny this loan application.
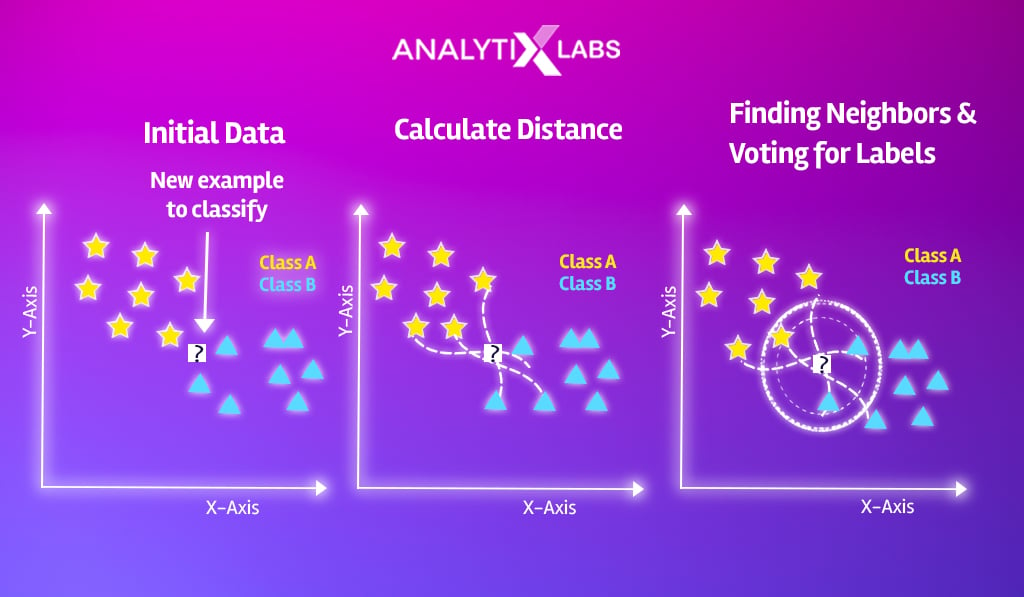
Distance algorithm
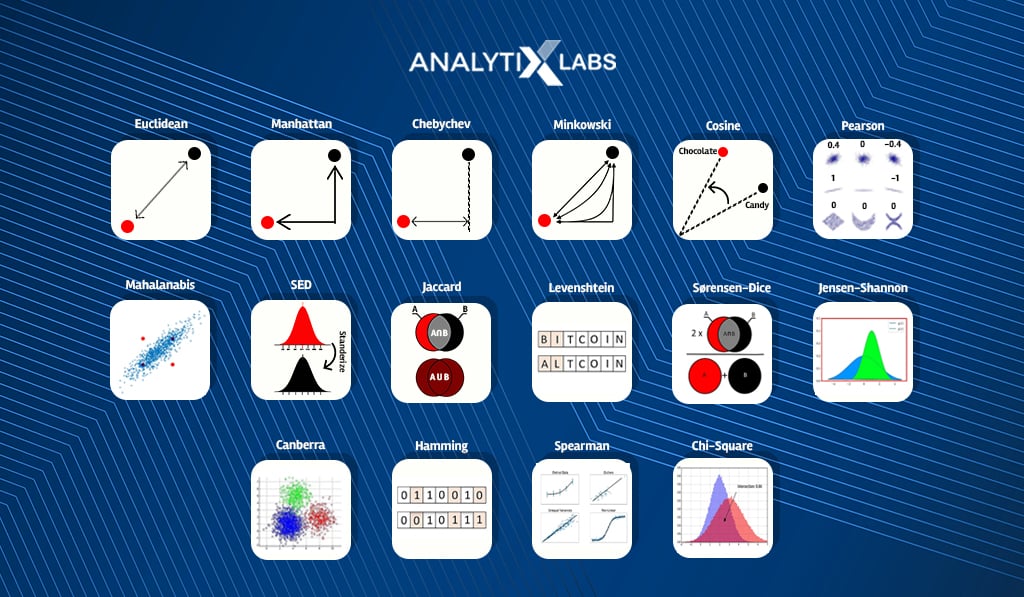
The first step of any KNN algorithm in machine learning is to calculate the distance from the new data point (in the model development understanding, this new data point refers to the observations in the test dataset) to all the other data points (refers to the training dataset). The question is now how to calculate the distance. Here you can use several formulas to calculate the distance between two data points. Common distance calculating metrics include-
- Euclidean Distance
- Manhattan Distance
- Minkowski distance
- Cosine Similarity
Here let’s consider the Euclidean distance, whose formula is-
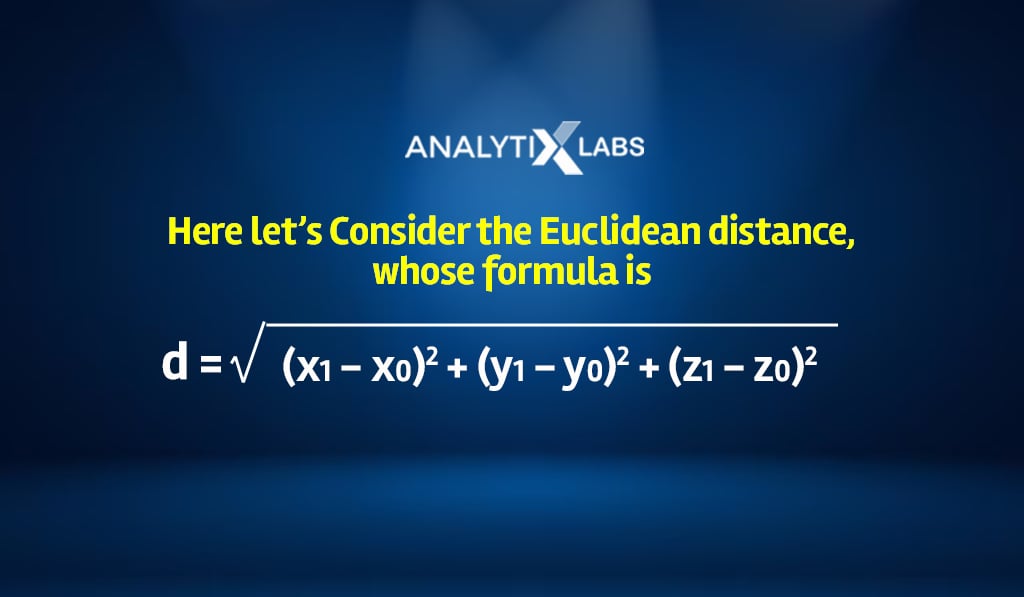
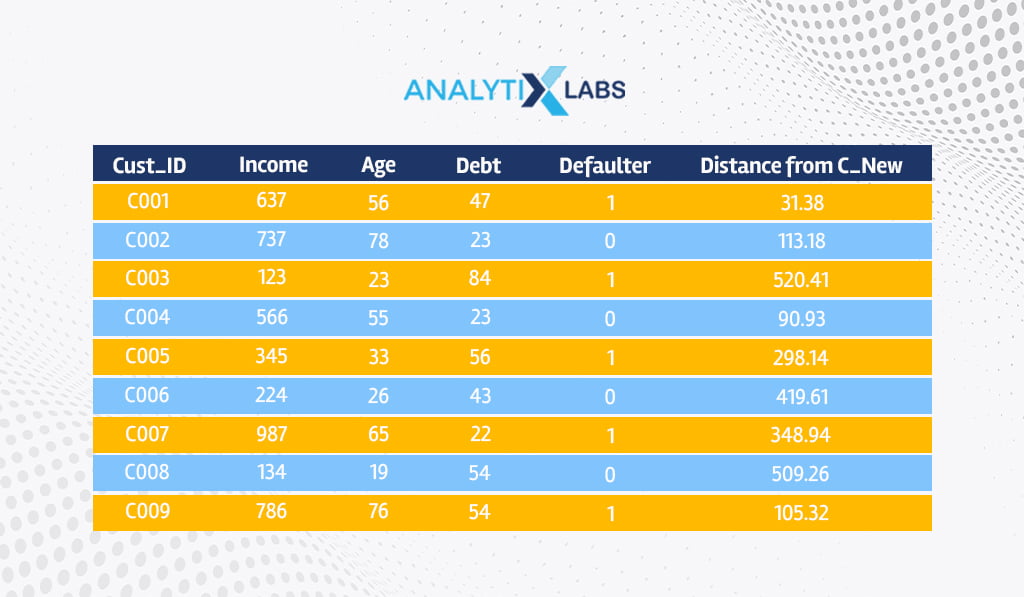
Therefore, we calculate the distance from the new applicant C_New to all the other historical applicants, such as C001, C002, etc.
For example, the distance from C_New to C001 will be-
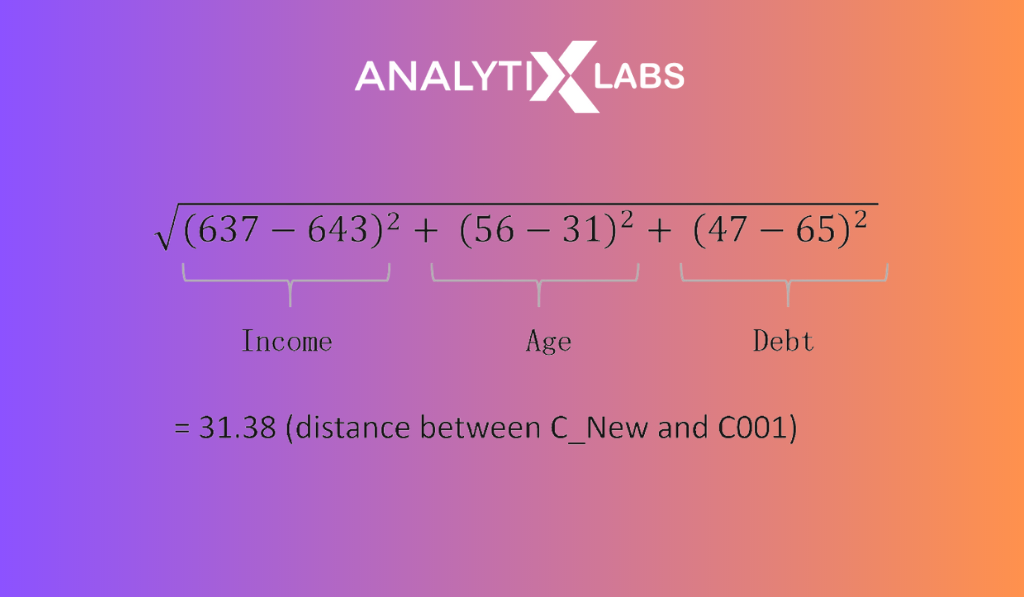
Similarly, we calculate the Euclidean distance from C_New to all other data points.
Majority Voting
Once the distances are calculated, you must decide on the K nearest neighbors you will focus on.
Here let’s pick three as the value of K. Therefore, we sort the data by distance in an ascending order to find those three applicants closest to C_New.
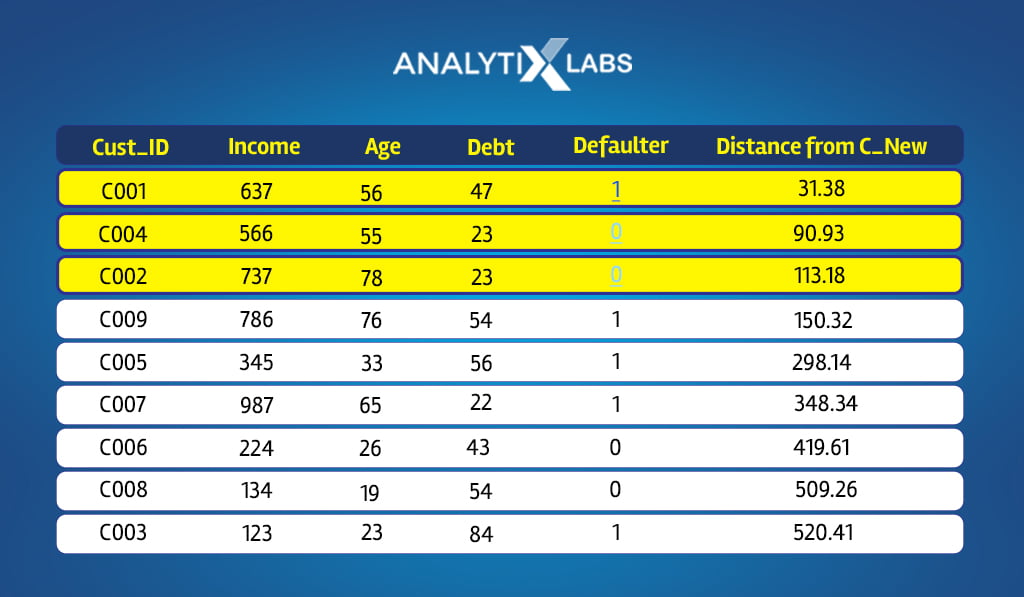
C001, C004, and C002 are the three applicants most similar/closest to C_New. If you look at the dependent variable, two applicants eventually repaid the loan out of these three, while C001 defaulted.
Outcome
The outcome of the new data point is decided by performing majority voting. As for the closest neighbors, the majority repaid the loan; the new applicant is predicted to be a repayer and hence can be granted a loan.
With the above example, I hope you now have a much better understanding of how the KNN algorithm in a machine-learning environment works. Still, the critical question that has not been answered is how to decide on the value of K.
Choosing the Right Value for K
As evident from the KNN full form, the role of K is critical in the success of any KNN model. There are many aspects of choosing the correct value of K as it affects the model’s working.
Ties
In a binary classification problem with two categories in the dependent variable, you must use an odd value of K, especially when majority voting is involved.
For example, you consider K=4; of the four closest neighbors, two belong to class A, while the others belong to class B. In such a scenario, you will not get the correct result.
This technique of choosing the odd value of K is limited to a binary classification problem.
If the problem is multiclass, i.e., there are more than two classes in the dependent variable, then you need a different approach.
In multiclass scenarios, you must avoid the multiples of the number of classes, i.e., if there are five classes, you must avoid 5, 10, 15, 20, and so on, as the value of K can lead to the problem of ties during the majority voting process.
Small value of K
If you consider an extremely small value of K, for example, one, then the predictions will be highly sensitive to outliers or any small fluctuation in the data.
This will cause the model to become extremely complex, causing it to overfit.
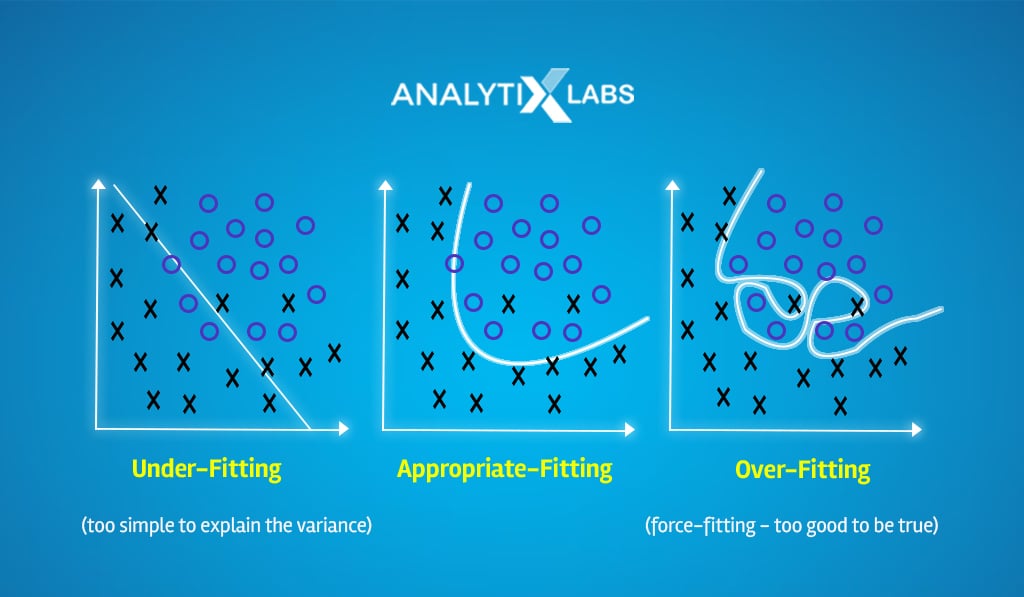
Large value of K
On the contrary, a significantly large value of K can desensitize the KNN model.
To understand this, let’s take an extreme example. In our previous examples, we had eleven applicants’ information in the historical data.
If we had taken the value of K as eleven, then the model’s output would de facto be the mode of the dependent variable. This means:
No matter your new data point, your answer would be the class with the highest frequency in the dependent variable.
Thus, an abnormally large value of K can underfit the model.
Solution
K nearest neighbor is supervised machine learning algorithm, and in machine learning, any algorithm working in such a setup can be converted into an optimization problem.
You can use a range of values of K, let’s say from 3 to 11, and calculate the model’s error rate for each value. You can then pick that value of K where the error was minimum.
To find this value of K, you can run a for loop calculating the level of accuracy for different values of K, or the machine learning concept of grid search and cross-validation can also be used for this purpose.
Regression Problem
One of the most significant benefits of K Nearest Neighbor in machine learning is that it can naturally solve classification and regression problems.
KNN is different in this sense as algorithms like Naïve Bayes cannot be used for solving regression problems.
In contrast, algorithms such as Support Vector Machines use a considerably different approach when trying to solve a regression problem. In the case of KNN, the only change is that the majority voting process is replaced by calculating the average.
Setting the example
Let’s modify the previous example by making the dependent variable continuous. Here rather than the loan status, the dependent variable is the amount of savings.
For the following new observation, we need to predict the amount of savings.
| Customer ID | Income | Age | Debt |
|---|---|---|---|
| C_New | 643 | 31 | 65 |
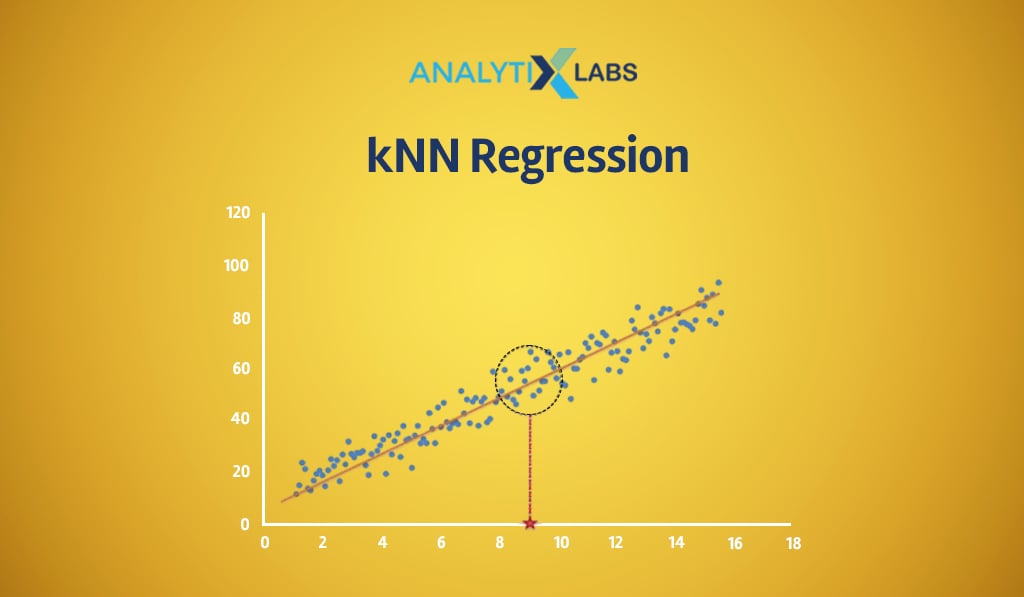
Averaging
Similar to what we discussed earlier, we consider K=3, and the closest data points to C_New pertained to C001, C002, and C004. As the dependent variable here is continuous, the KNN regressor, rather than performing majority voting, calculates the average.
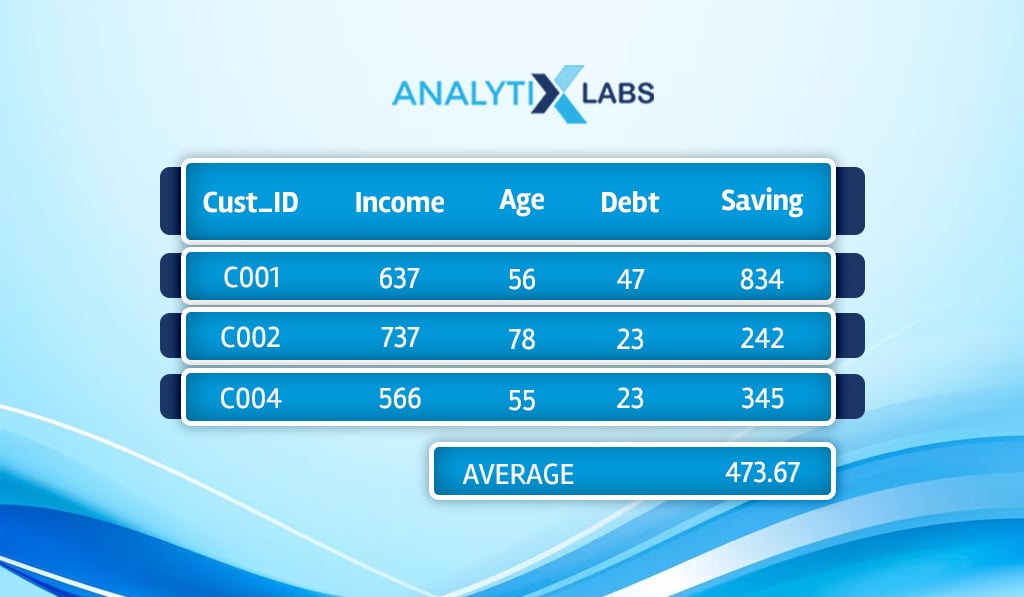
Outcome
The KNN regressor, in this case, considers 437.67 as the predicted amount of saving by C_New.
As you can see, one of the benefits of k nearest neighbor in machine learning is the similarity of the workings of KNN classifier and regressor.
However, there are specific issues associated with each of them that you must keep in mind.
Impact of Imbalanced Dataset and Outliers
Certain inherent issues are related to the KNN regressor and classifier.
KNN Classifier
The primary issue with the KNN classifier is that it can give biased results if there is a class imbalance in the train data.
Let’s take a binary classification example.
KNN ideally assumes that the distribution of the classes is uniform. If this is the case and the class for a new random data point is to be predicted, then based on the density of the data point around it, the class will be predicted.
However, if most observations belong to class A and fewer to class B in a dataset, then the probability of being surrounded by class A will be higher for a random new data point.
KNN Regressor
For the KNN regressor, the problem is slightly different. Here as the dependent variable is continuous, there is no concept of class imbalance, but there can be outliers.
As the average is calculated in the KNN regressor, the outcome can be highly susceptible to outliers. This is especially true if the outlier is there in the selected nearest neighbor observations.
Suggestion
When using the KNN classifier, you must try to reduce the class imbalances, and when using the KNN regressor, you must identify the outliers in the dependent variable.
However, an inherent issue with KNN applies to both- the regressor and classifier that becomes evident when the data is not standardized.
Why you should scale data?
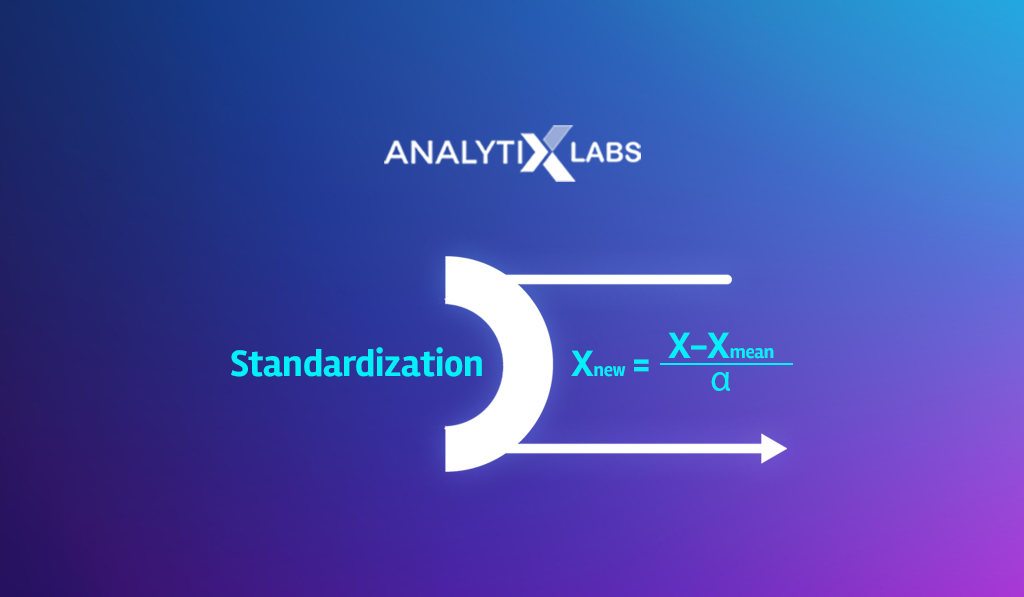
Distance-based models can be used for solving multiple problems, but they come with a significant drawback that must always be addressed through data standardization.
Let’s go back to the previous example to understand the importance of scaling/standardization of data when using KNN.
- Understanding with example
In the loan application example, we had three predictors – Income, Age, and Debt. These variables are involved in the calculation of distance. We used Euclidean distance to calculate the proximity of the observations to a new data point.
However, there is an issue: the distance metric treats all the columns equally. It will take the sum of the squared distances from all three axes and provide the final distance.
But if you look closely, you will realize that certain variables are less in scale and consequently will have little effect on the resultant distance.
For example, the scale of Age is less between Income, Age, and Debt, as its values will typically fluctuate between 18 and 100, whereas Income and Debt can vary from 100 to 10000s.
This will cause Age to have little to no say in deciding the nearest neighbor as they contribute little to the final distance value causing the difference in Age and Debt to overpower the process. To resolve this issue, we must standardize the data so that all predictors’ scale is the same.
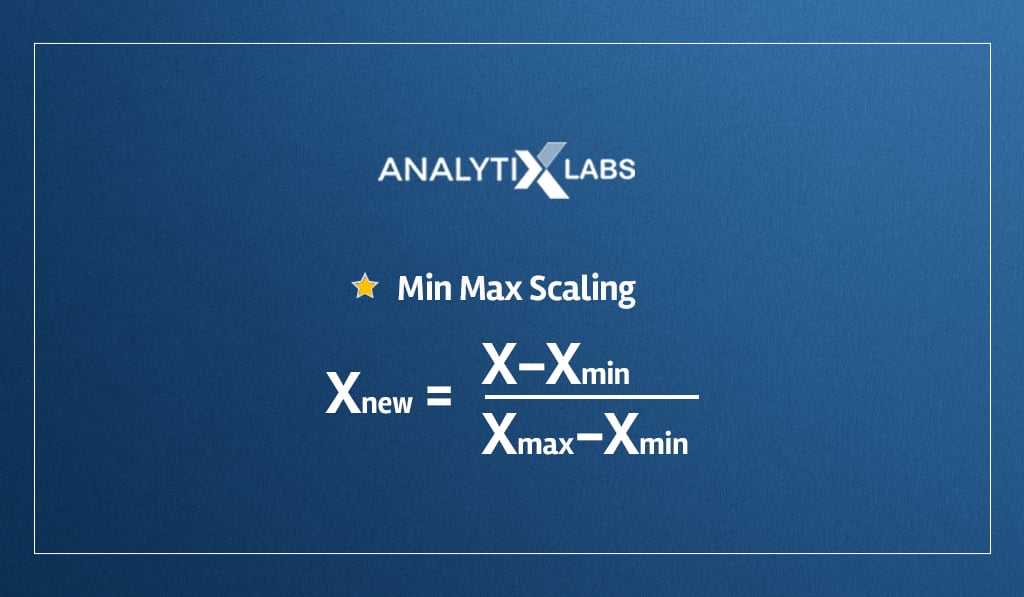
Methods of Scaling Data
There are multiple ways of making the data be on the same scale, such as:
- Minimum Max Scaling
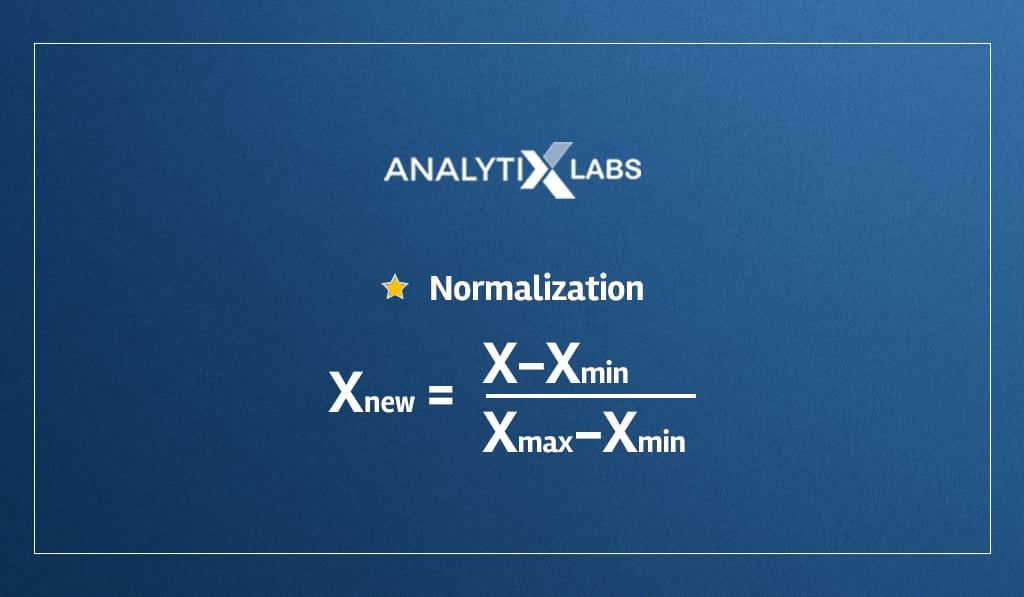
- Normalization
- Standardization
- Robust scaling

While we are on the topic of the limitations of KNN, let’s also discuss the pros and cons of KNN.
Also read: Regularization in Machine Learning
Pros and Cons of Using KNN
KNN is one of the most popular algorithms in machine learning, and it comes with its own set of advantages and disadvantages that a data scientist must be aware of when choosing to work with this algorithm.
Pros
- No assumptions
Being a non-parametric algorithm, KNN doesn’t have to worry about assumptions related to the data distribution for it to work correctly.
- Solve multiple types of KNN problems
As discussed in detail, KNN can solve both regression and classification problems. Note that the common question is that if KNN is supervised or unsupervised. The answer is that KNN works in a supervised learning setup, but other distance-based models can be used for segmentation, and they work in an unsupervised learning setup such as K-means.
- Natural multiclass classifier
Unlike other classifiers like Logistic Regression or Support Vector machines that have to use the one v/s other approaches to solve classification problems, KNN solves multiclass problems naturally. This is because it simply looks at K number of closest observations, and no matter the number of classes, it simply performs majority voting and provides an answer.
- Solve complex problems
KNN is a non-linear algorithm, and because it doesn’t require a lot of statistical assumptions, KNN can solve complex problems that traditional statistical algorithms like logistic regression may not easily solve.
- Intuitive
KNN is simple to comprehend and implement.
Cons
- Susceptible to outliers
As KNN uses a distance metric to calculate proximity, it is susceptible to outliers as they can significantly skew the results.
- Training time
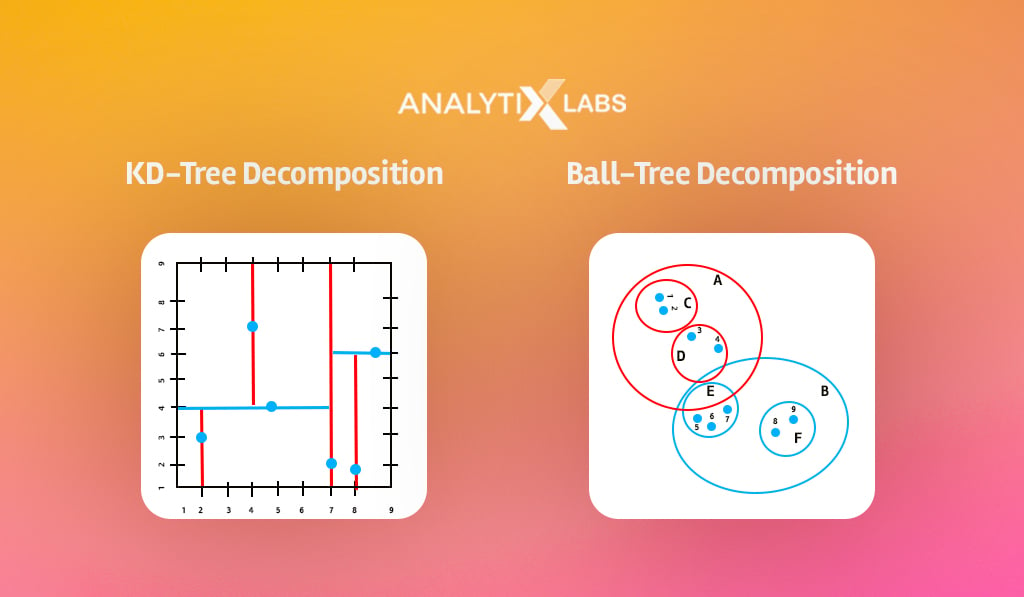
KNN, in its testing phase, has to calculate the distance from each testing data point to all other training data points. This causes KNN to become slow in the testing phase as opposed to other algorithms, such as ANN, which is fast in the testing phase (but slow in the training phase).
To resolve this problem, methods such as KD-Trees, Ball-Tree, and Local Sensitive Hashing should be used that limit the training data involved in the process.
- Limitation of majority voting
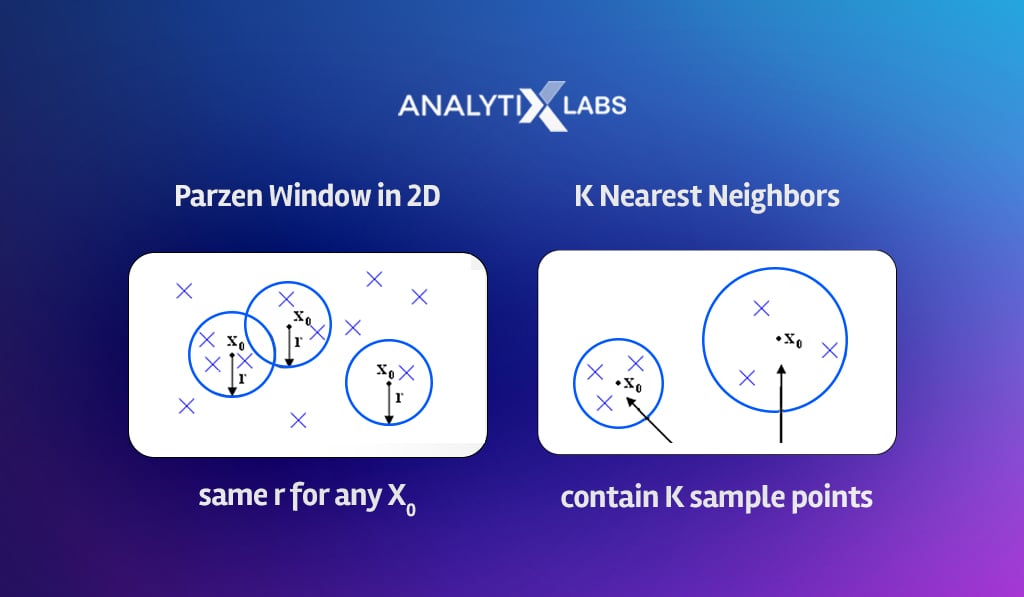
Majority voting is a simplistic process. If the value of K is seven, all these seven observations are treated equally, even though the distance of each observation from the new data point might differ.
To resolve this, alternatives to majority voting should be exploited, such as Parzen Windows, which fixes the radius of the data space to find the nearest neighbors.
You can also use Kernels, where the involvement of the observations in deciding the outcome diminishes as the distance from the new data point increases.
How KNN Helps – Real-time Examples
Now, with all aspects of KNN covered, let’s discuss a few real-world examples of KNN being helpful.
-
Recommendation systems
KNN is often used in recommendation systems. The idea behind a recommendation system is to analyze your behavior and choices, then recommend products that are most similar to those you have already consumed or recommend those products that have been consumed by those individuals that are most similar to you (in terms of demography, behavior, etc.)
-
Concept search
KNN is also used when there is a need to search documents there are similar semantically. E-discovery software is commonly used in legal proceedings, and they leverage KNN and other similar algorithms.
-
Outlier detection
KNN can be used for detecting anomalous data points. It’s helpful in fraud detection.
-
Missing value imputation
For imputing missing values, KNN can be used where it finds the most similar observation and uses it to impute the missing value.
-
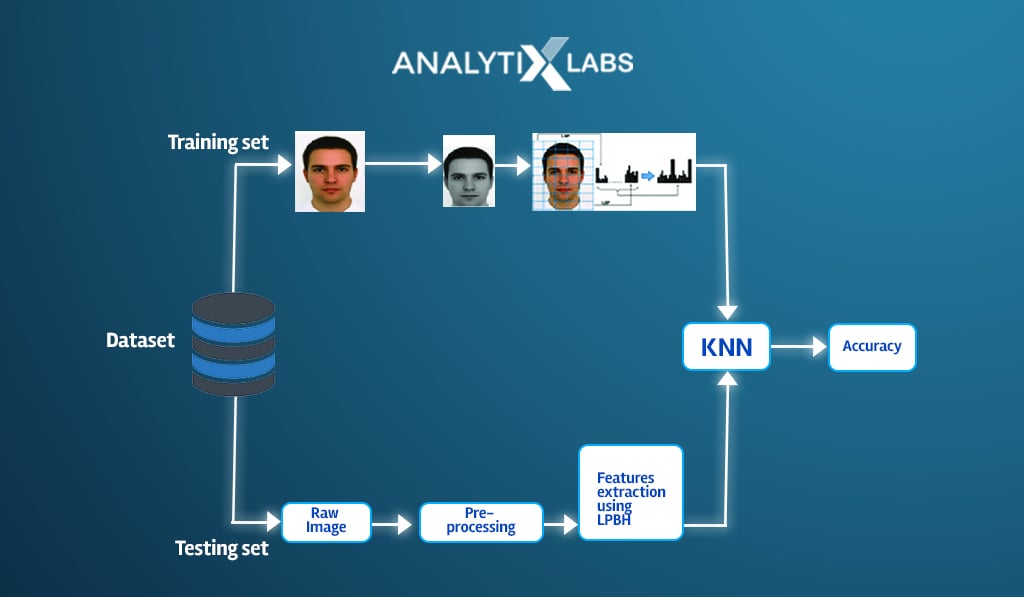
Facial recognition
The idea behind facial recognition is to use a data bank that acts as the training data and matches the faces using it. Here again, KNN can be helpful though it’s not as effective as other neural-based algorithms.
Also read: Ultimate Guide To Anomaly Detection
You can also explore some more AI-based projects with our 21 Artificial Intelligence Project Ideas blog.
Understanding KNN with Coding in R
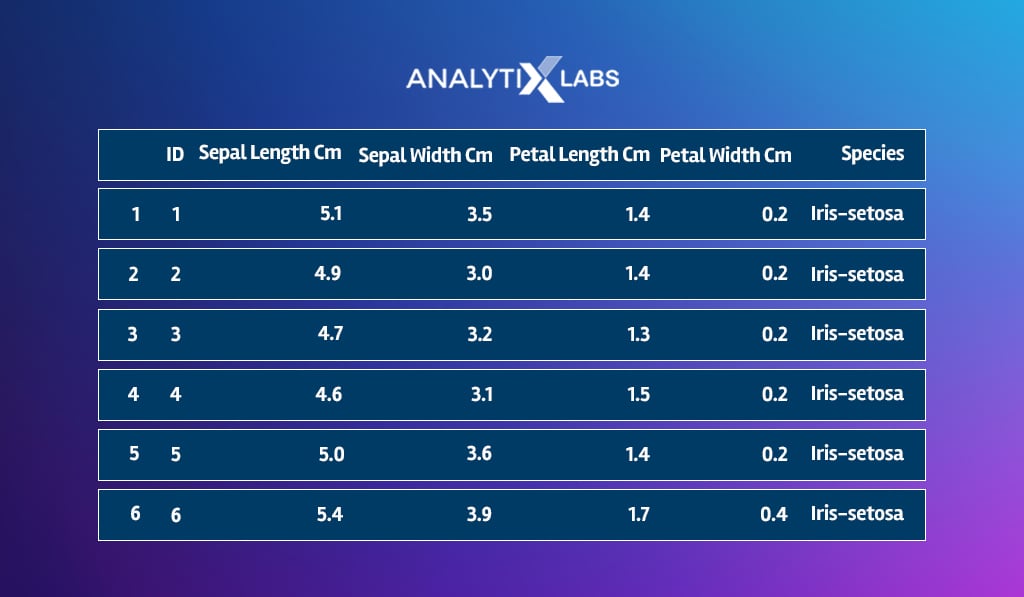
Now, let’s look at some code you can use to build your own KNN model in R. I build a KNN classifier using the well-known Iris dataset with three categories in the dependent variable.
Start with importing the iris dataset available in the CSV format.
# Importing the Iris data set iris = read.csv('Iris.csv')
# Exploring the first few rows head(iris)
You get:
# Counting the number of rows nrow(iris)
You get:
[1] 150
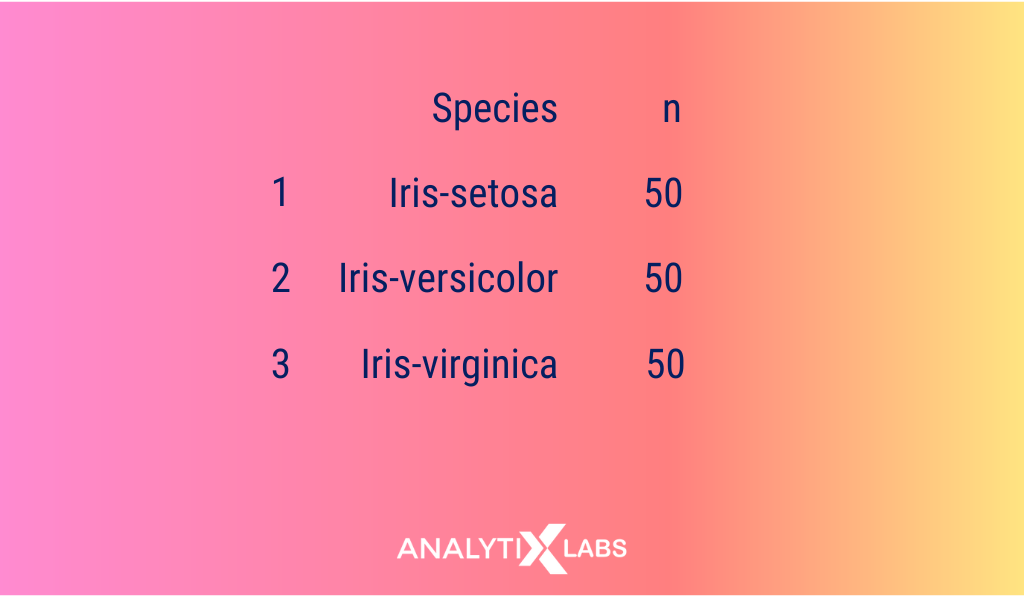
As mentioned earlier, the iris dataset is comprised of three classes.
# Counting the number of classes in the dependent variable dplyr::count(iris, Species, sort = TRUE)
# Dropping the Id variable iris$Id <- NULL
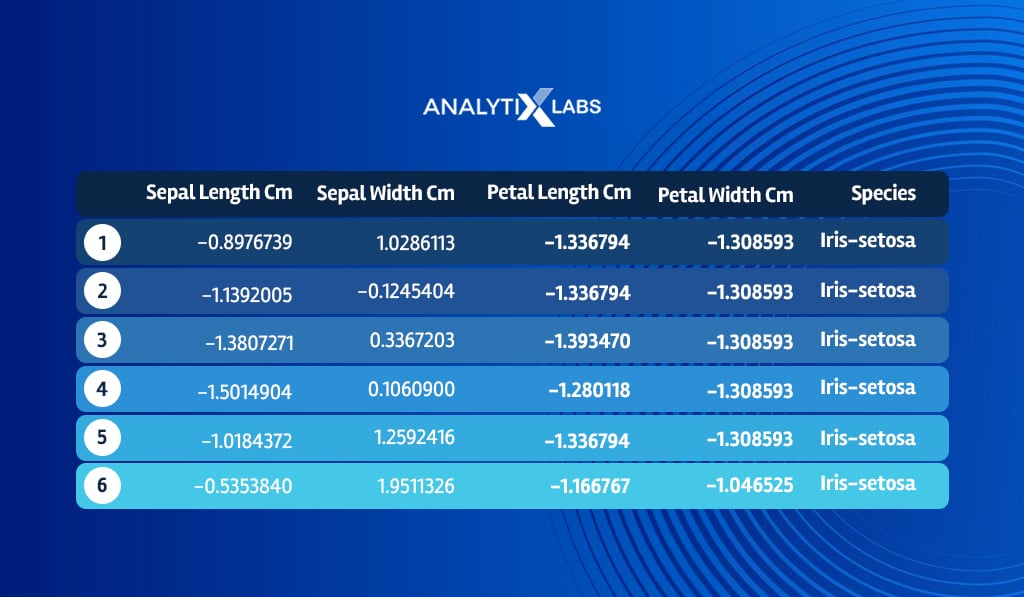
A major prerequisite for using KNN is ensuring the independent variables are on the same scale.
# Scaling the data (except the dependent variable) iris_scaled <- iris iris_scaled[, -5] <- scale(iris_scaled[, -5]) head(iris_scaled)
You now split the data into train and test, where the KNN algorithm will learn from the train data and will predict the labels for the test data.
# Splitting the data into train and test in a 70% train and 30% test split set.seed(1234) ind <- sample(2, nrow(iris_scaled), replace=TRUE, prob=c(0.7, 0.3)) trainData <- iris_scaled[ind==1,] testData <- iris_scaled[ind==2,]
You can first run the KNN classifier using any value of K. Here, I consider K=3.
# Running KNN using K=3 library(class) Test_k3 <- class::knn(trainData[,-5], testData[,-5],trainData$Species, k=3, prob=TRUE) Test_k3
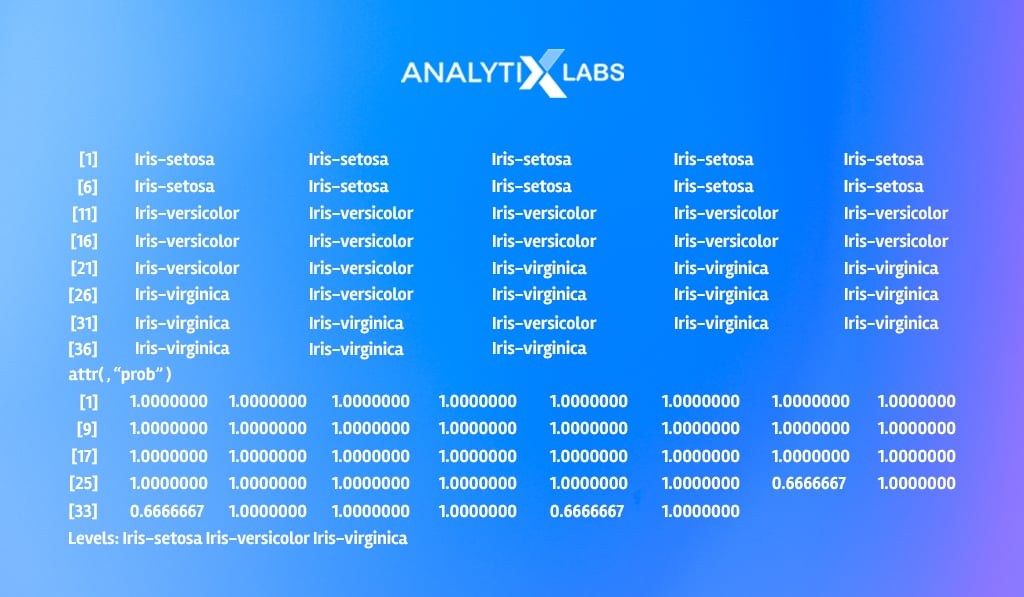
Let’s now evaluate the predictions generated on the test data from the above-created KNN model.
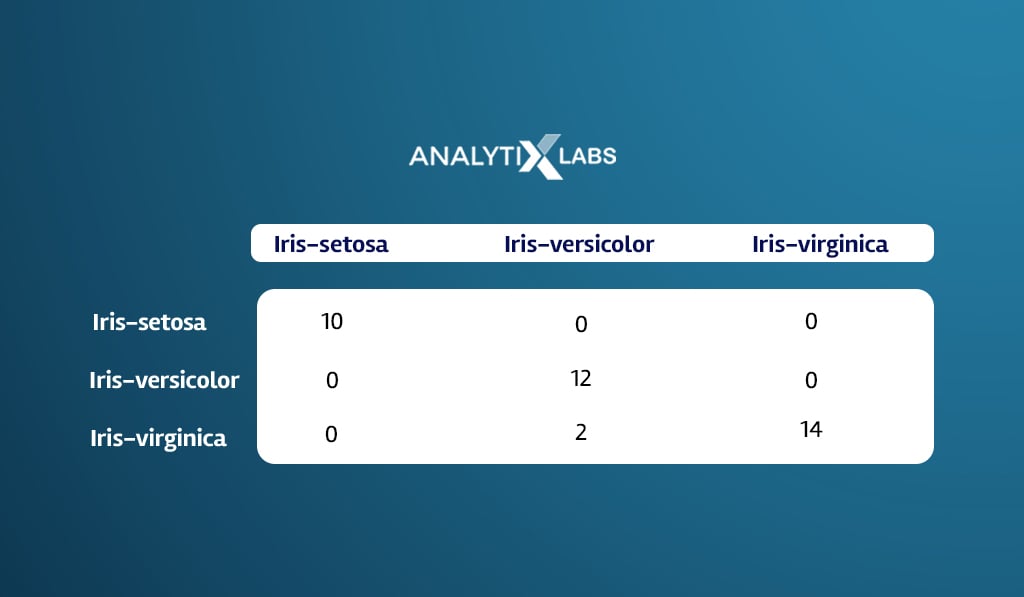
# creating Confusion matrix table(testData$Species, Test_k3)
Also read: Confusion Matrix in Machine Learning: How it Helps in Solving Classification Issues
You can calculate the classification accuracy, which is the proportion of observations whose ground truth labels match the predicted label.
# calculating Accuracy sum(Test_k3==testData$Species)/length(testData$Species)*100
[1] 94.73684
The KNN model with K=3 has provided us with a classification accuracy of roughly around 94%, but I don’t know if this is the best value of K.
To find out, you run a for loop with different values of K and calculate the classification accuracy score for each value. You eventually pick that value of K, where the accuracy is the highest.
# Creating empty variables KnnTestPrediction <- list() accuracy <- numeric()
# Running for loop for k=1 to k=100... for(k in 1:100){
# Predicting labels for each k KnnTestPrediction[[k]] <- knn(trainData[,-5], testData[,-5], trainData$Species, k, prob=TRUE)
# Calculating classification accuracy for each value of k accuracy[k] <- sum(KnnTestPrediction[[k]]==testData$Species)/length(testData$Species)*100 }
# Plotting the accuracy for each value of k plot(accuracy, type="b", col="black", cex=1, pch=20, xlab="Value of K", ylab="Accuracy Score", main="Accuracy for different values of K")
# Adding a grey vertical line passing where highest accuracy is achieved abline(v=which(accuracy==max(accuracy)), col="grey", lwd=1.5)
# Adding a green horizontal line where highest accuracy is achieved abline(h=max(accuracy), col="green", lty=2)
# Adding a red horizontal line where lowest accuracy is achieved abline(h=min(accuracy), col="red", lty=2)
If you notice, you will find the accuracy score increases and reaches its highest when the value of K is between 5 and 15.
However, it then perpetually drops as you increase the value of K.
# Representing the findings in the form of a table accuracy_scores <- cbind(data.frame(1:100),data.frame(accuracy)) colnames(accuracy_scores) <- c('K','Accuracy') accuracy_scores[accuracy_scores$Accuracy==max(accuracy_scores$Accuracy),]
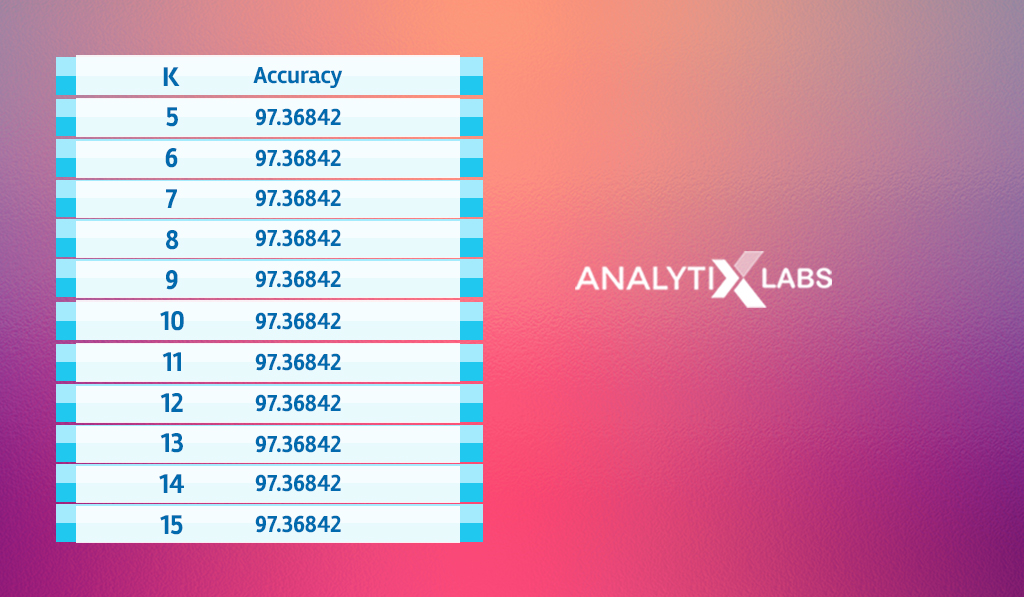
As the accuracy score stagnates for the value of K between 5 and 15, you can create a KNN classifier using any of these values.
In such a scenario where you have multiple options, you can pick a value from the middle and ensure that it’s not multiple of the number of classes. Therefore, as we have three classes, you should create a KNN model where the value of K is 8, 10, or 11.
FAQs
1. What is KNN algorithm example?
A common example of KNN is a K Nearest Neighbor classifier to create a predictive model.
2. Where is KNN algorithm used?
KNN is used in the following industries-
- E-Commerce and Streaming Service: help in creating a recommendation system
- Legal: helps in creating an e-discovery tool to find semantically similar documents
- Cybersecurity: helps in creating facial recognition software to identify threats
3. What is KNN and its applications?
KNN is a distance-based machine learning algorithm that looks for similar observations to answer classification or regression problems. Its application ranges from simple missing value imputation to complex facial recognition systems.
I hope this article gave you a 360-degree understanding of KNN’s applications, limitations, pros, cons, etc. If you have any feedback, then do write back to us.