In a perfect world, we can feed flawless data to a machine learning model, and get absolutely perfect results. Unfortunately, algorithms are not always accurate. Infact, an organization is always at risk of losing millions of dollars as a result of a high error rate in the business. So, how can you ensure a classification algorithm will perform with maximum accuracy? The answer is the Confusion Matrix.
What is Confusion Matrix?
A confusion matrix in machine learning helps quantify the variables influencing the performance, accuracy, and precision of your classification model . It allows you to make better and more informed judgments.
In this article, we will examine what is confusion matrix, why we need it, the confusion matrix examples, and applications of confusion matrix in data mining.
Understanding Confusion Matrix
Confusion matrices are a widely used measurement when attempting to solve classification issues. It helps solve both binary classification and multiclass classification issues.
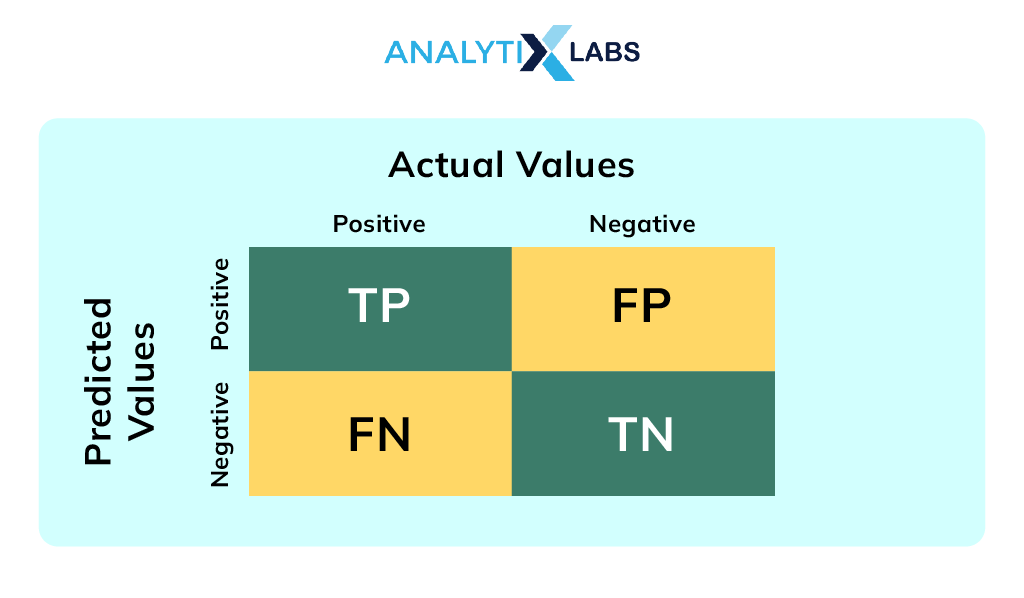
The confusion matrix for a binary classification task appears as follows:
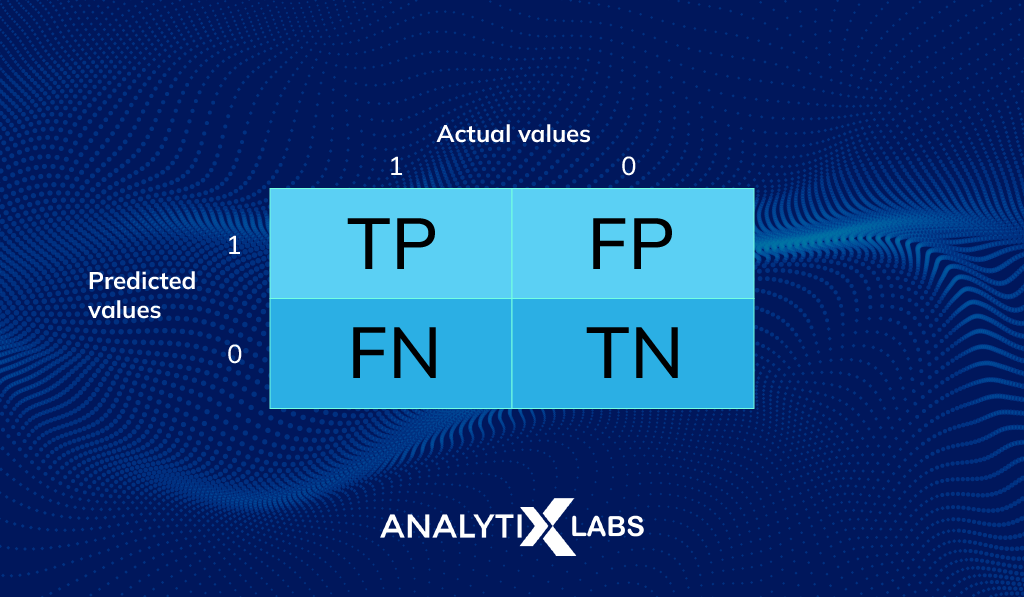
It displays the various contrasts between actual and predicted values.
Let’s look at each of these Elements of the Confusion Matrix:
| Element | What it means |
|---|---|
| True Positive (TP) | values that both turned out to be positive and were expected to be positive |
| False Positive (FP) | values that were genuinely anticipated to be negative but turned out to be positive. Also called a Type I error |
| False Negative (FN) | values are ones that were projected as negative but were actually positive. An error of the same type as Type II |
| True Negative (TN) | values are those that were both genuinely negative and projected to be negative |
Additional evaluation metrics related to confusion matrix
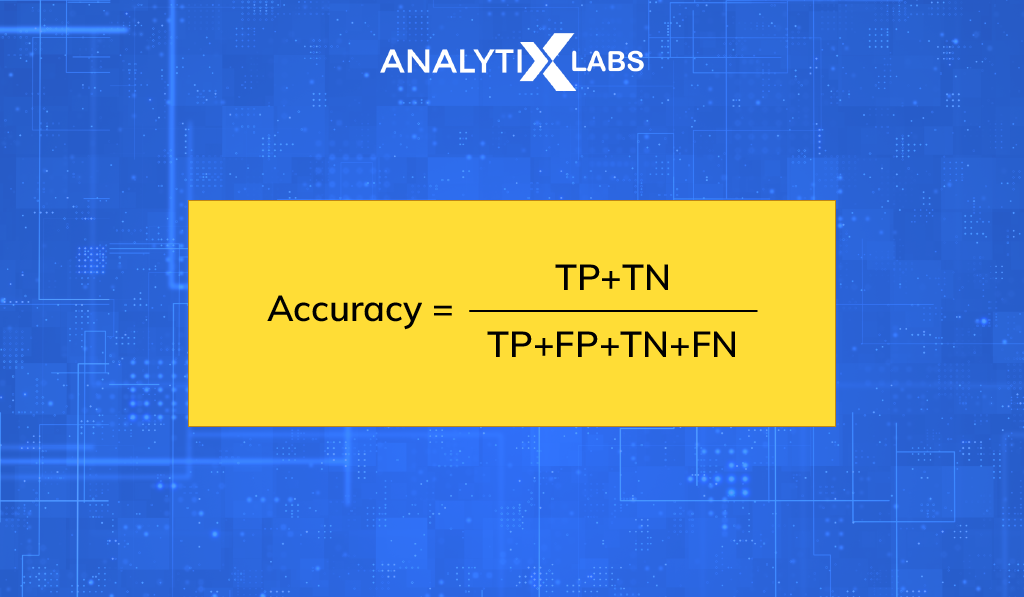
1. Accuracy
Accuracy from confusion matrix is determined by dividing the total number of correctly predicted outcomes by all of the outcomes. It is one of the most often used metrics in classification.
The confusion matrix formula for accuracy is mentioned below. It is used to determine a model’s reliability (via a confusion matrix).
Since an accuracy confusion matrix might be deceptive when applied to unbalanced datasets, alternative metrics based on confusion matrices are also relevant for assessing performance.
The “confusion matrix()” method from the “sklearn” module in Python can be used to obtain the confusion matrix.
The command “from sklearn.metrics import confusion matrix” can be used to import this function into Python. Users must supply the function with both actual values and expected values to obtain the confusion matrix.
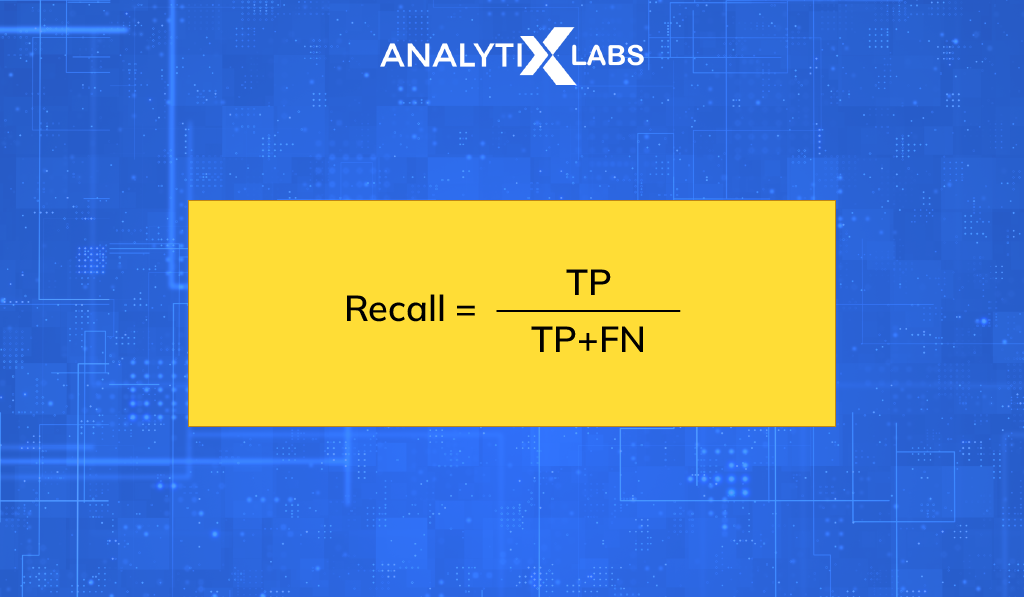
2. Sensitivity/Recall
Recall is a metric used to determine how many positive outcomes out of all positive outcomes were properly predicted.
The confusion matrix formula for the recall is:
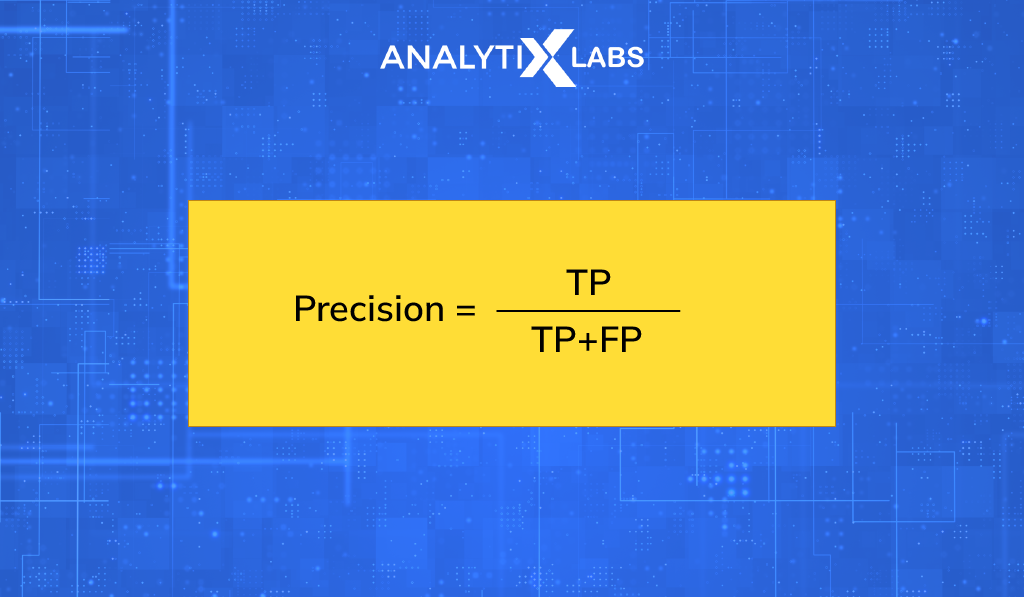
3. Precision
Out of all positively expected outcomes, precision measures how many are truly good events. Precision can be calculated using the below confusion matrix formula-
4. F Beta Score
F1 score is another name for the F Measure. The balance between recall and precision is represented by the F1 score. The harmonic mean of Precision and Recall, or F beta score, captures both of their contributions. The contribution in the calculation below depends on the beta value.
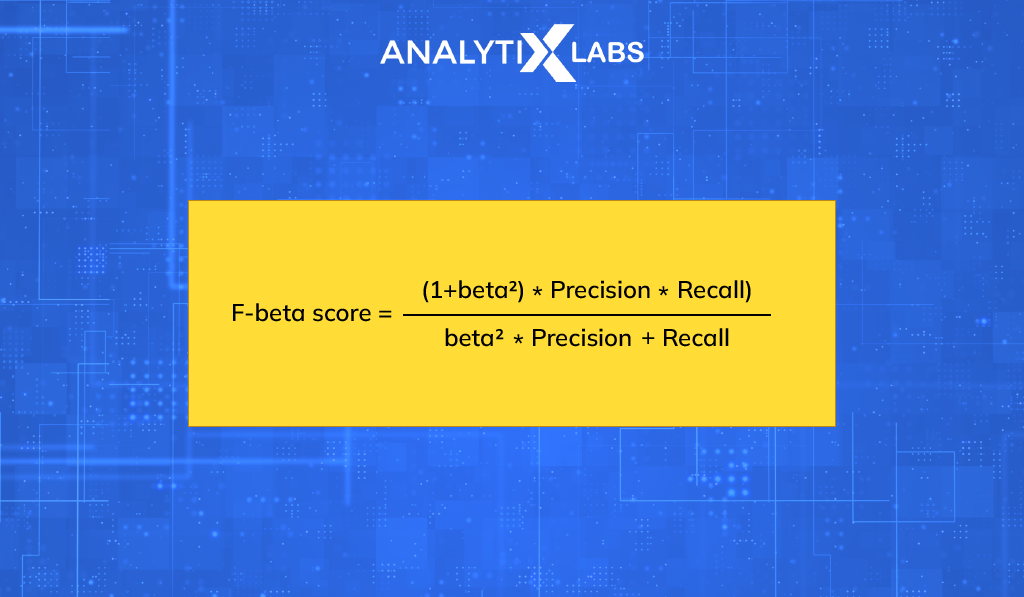
When beta is set to 1, we get the formula for the F1score, where Precision and Recall both contribute equally.
The model is better when the F1 score is higher.
Precision is given more weight than Recall when the beta value is less than 1, and vice versa when the beta value is greater than 1.
Why do you need Confusion Matrix?
Confusion matrices are used by data scientists to tackle classification problems with two or more classes when creating machine learning systems.
The matrix arranges input and output data so that analysts and programmers can see the precision, recall, and accuracy of the machine learning algorithms they use to create system designs.
The confusion matrix is vital for deciding on two outcomes in a two-class, or binary, classification problem. Depending on how these variables are represented numerically in a machine learning system, the results could be either positive or negative.
Confusion matrices are used to determine the following in binary classification problems:
- Accuracy rate
- Misclassification rate
- True positive rate
- True negative rate
- False-positive rate
- False-negative rate
- Precision rate
It assesses how well classification models perform when they make predictions based on test data and indicates how effective our classification model is.
It not only identifies the classification error but also the specific sort of error, such as type-I or type-II error.
Let’s assume that the data is significantly class-balanced. When this occurs, i.e., when one class has more data instances than the others, a model may accurately predict the majority class in all circumstances while failing to forecast the minority classes.
Confusion matrices come in handy in this situation.
A confusion matrix aids in visualizing the results of a classification task by providing a table arrangement of the various outcomes of the prediction and findings. It creates a table with all of a classifier’s predicted and actual values.
Learn from AnalytixLabs
The above example shows that the Confusion Matrix in Machine Learning is very important to learn. With our premium machine learning learning materials you can master such concepts in machine learning.
How to Calculate a Confusion Matrix
The fundamental steps for calculating confusion matrices for two-class classification issues are as follows:
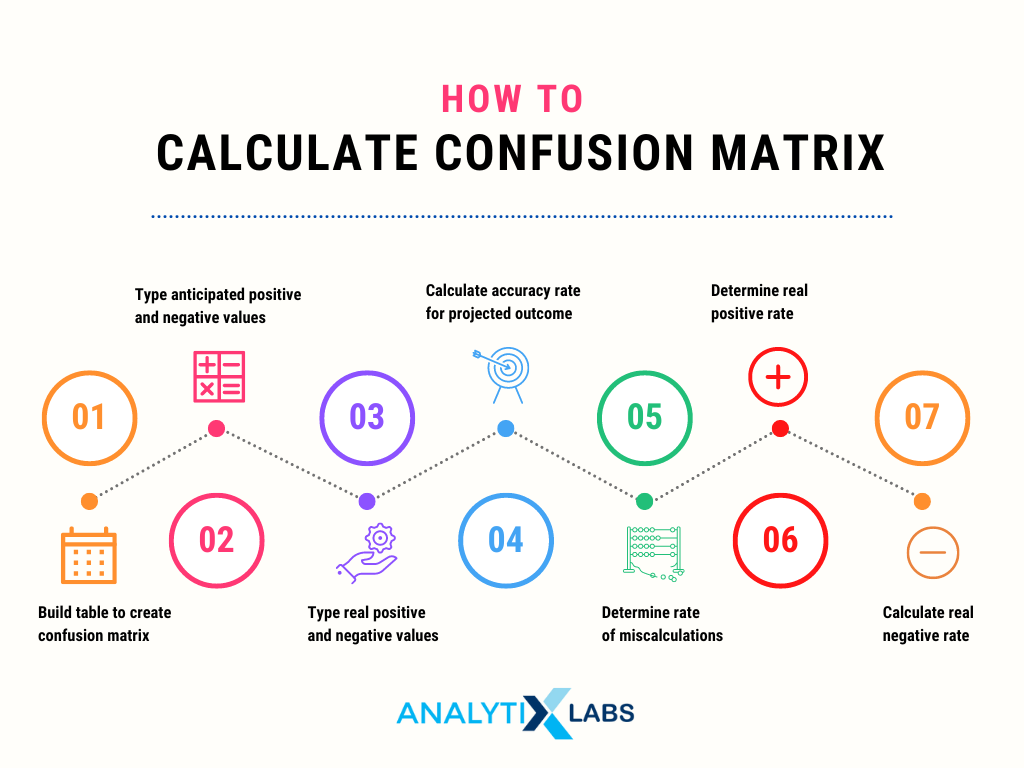
1. Build your table
You need a table to create the confusion matrix before entering any data. Make a table with two rows, two columns, and a third row and column for your chart’s labels. The actual outputs are shown on the left side of the matrix, while the anticipated outputs are shown on the right side.
2. Type in the anticipated positive and negative values
List your estimated values for both positive and negative outcomes in the prediction row and column. A data set with 120 samples, for instance, might be used to forecast the proportion of pass-fail exam scores.
This indicates that two outputs can be “pass” or “fail.”
The values you input as the outputs under the columns for your predicted “pass” and “fail” values correspond to your prediction of 100 passing scores and 20 failing scores, respectively.
3. Type in your real positive and negative values
You can input the actual outputs in your matrix after assessing your predictive values to see if they are accurate. The “true” and “false” numbers in the table are the results that occur. The figures you have for “true positive” and “false negative” correspond to the actual positive results. Actual negative outcomes are represented by the “true negative” and “false positive” numbers.
The passing scores in a pass-fail exam indicate good outcomes, while the failing scores stand for undesirable outcomes.
Your real positive and negative values in the matrix will be these figures if there are 110 passing tests and 10 failing tests.
Your false positive and negative numbers would both be 10 since your estimation of the passing and failing scores was incorrect by 10. So, there will be 10 more values for failing and 10 less for passing.
4. Calculate the accuracy rate
You may calculate the accuracy rate for projecting desired outcomes using the finished matrix. This indicator tracks how frequently you predict outcomes properly. Understanding mistake rates and determining the areas where data system changes are required can both benefit from this.
Add the genuinely positive and negative values together, then divide the result by the total number of values in your data collection to determine the accuracy rate from the confusion matrix.
With the example test results, accurately predicting 100 passing scores and 10 failing scores results in a total of 110 accurate predictions out of 120 total scores, for an accuracy rate of 92%.
5. Figure out the rate of misclassification
The misclassification rate indicates how frequently your confusion matrix is off in its predictions of the actual positive and negative outputs. By combining the false positive and false negative numbers, and then dividing this total by the overall number of items in your data set, you may determine this value.
Consider, for example, that you forecast 10 passing scores and 10 failing scores for the exam in the previous example, but you are mistaken.
In your matrix, the outputs for false positive and false negative would both be 10. These numbers are added together to provide a total of 20, which you divide by the 120 test results.
Consequently, you only anticipate an outcome inaccurately 17% of the time, or at a misclassification rate of 0.166, or roughly 17%.
6. Determine the real positive rate
Recall value, which reflects how frequently a system output is positive when you forecast a positive outcome, is a measure of a data set’s genuine positive rate.
The recall rate is calculated by dividing the number of positive results you accurately predicted by the number of positive outcomes you got after conducting your study. Consider, for instance, that you accurately predicted 100 passing marks.
Given that you predicted 100 of the 110 passing scores with accuracy, this value is positive. The recall rate equals 0.91, or 91% when this actual positive number is divided by the 110 passing scores.
7. Calculate the real negative rate
The specificity rate, which displays how frequently your classifier accurately predicts a negative event, is the genuine negative rate of your matrix.
Divide the total number of bad outcomes you properly predicted by the number of actual negative outcomes you found in your analysis to arrive at this rate.
Assume that out of 20 forecasts, you accurately predicted 10 failing scores using the exam results from the preceding example. You now have a 50% true negative or specificity rate.
Example of a confusion matrix calculation
In order to clearly understand the above details, let us look at a confusion matrix example.
To determine if a population carries a certain genetic variant, environmental scientists must solve a two-class categorization issue. Before computing the confusion matrix, assuming the researchers used 500 samples for their data analysis, a table for their predictive and actual values is created.
After developing the matrix, the researchers examine their test data.
Assume the researchers’ prediction that 150 of the test samples lack the genetic variation and 350 of them do. If they discover that there are indeed 305 samples with the variation, there are only 195 ones without it.
These values become the matrix’s “true” values, and the researchers then insert the data into the table:
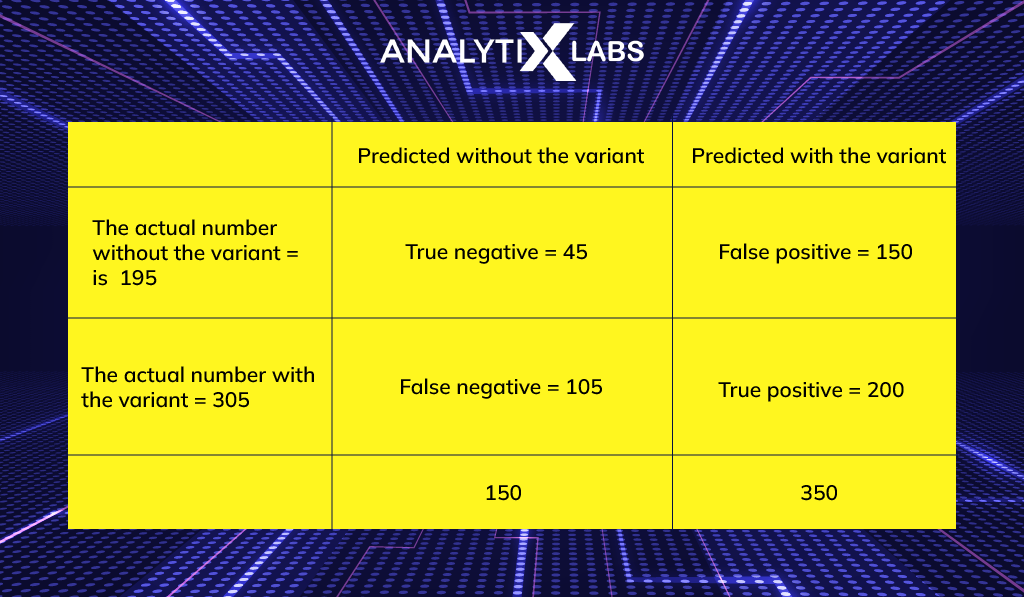
The scientists can then calculate their classification model’s real positive and negative rates, accuracy rate, and misclassification rate using the information from the confusion matrix:
The recall rate is calculated as follows:
- (true positive value) / (actual positive value): (200 / 305) = 0.66, or 66%.
- Specificity rate = true negative value / actual negative value, or (45 / (195), is equal to 0.23, or 23%.
- The accuracy rate is equal to (true positive value + true negative value) / (total number of samples), which equals (200 + 45) / (500) = (245) / (500) = 0.49, or 49%.
Classification Accuracy and its Limitations:
An indicator of classification accuracy is the proportion of accurate predictions to all other predictions.
- classification accuracy = correct predictions / total predictions
When the result is multiplied by 100, it is frequently given as a percentage.
- classification accuracy = (correct predictions / total predictions) * 100
Classification accuracy is calculated as correct predictions divided by all predictions multiplied by 100.
It is also simple to flip the value to convert classification accuracy into a misclassification rate or error rate, as in:
- error rate = [1 – (correct predictions / total predictions)] * 100
Although a good place to begin, classifier accuracy frequently runs into issues in real-world situations.
The biggest drawback of classification accuracy is that it obscures information that is necessary to fully comprehend how well your classification model is doing.
Classification accuracy may obscure information you need to assess your model’s effectiveness. But happily, a confusion matrix can help us separate these specifics.
- False positive and false negative values divided by the total number of samples equals (150 + 105) divided by (500) divided by (255) divided by (500) equals 0.51, or 51%, misclassification error rate.
Scientists can raise the accuracy of forecasting genetic variants in a population by modifying or improving the classification algorithm with the use of this data evaluation.
Two-Class Problems are Special
We frequently try to distinguish between observations with a particular outcome and regular observations in a two-class situation.
For example, a disease condition or event that was not a disease state or event before.
We can designate the event row as “positive” and the row with no event as “negative” in this fashion. The predictions in the event column can then be classified as “true” and those that did not occur as “false”.
This results in:
- “True positive” when event values match predictions exactly.
- “False positive” for improperly anticipated event values.
- “True negative” for no-event values that were accurately predicted.
- “False negative” for no-event values that were mistakenly predicted.
Confusion Matrix in Python with scikit-learn
The scikit-learn (also known as sklearn) Python package is used to generate a confusion matrix and determine several significant metrics as seen in the code snippet below:
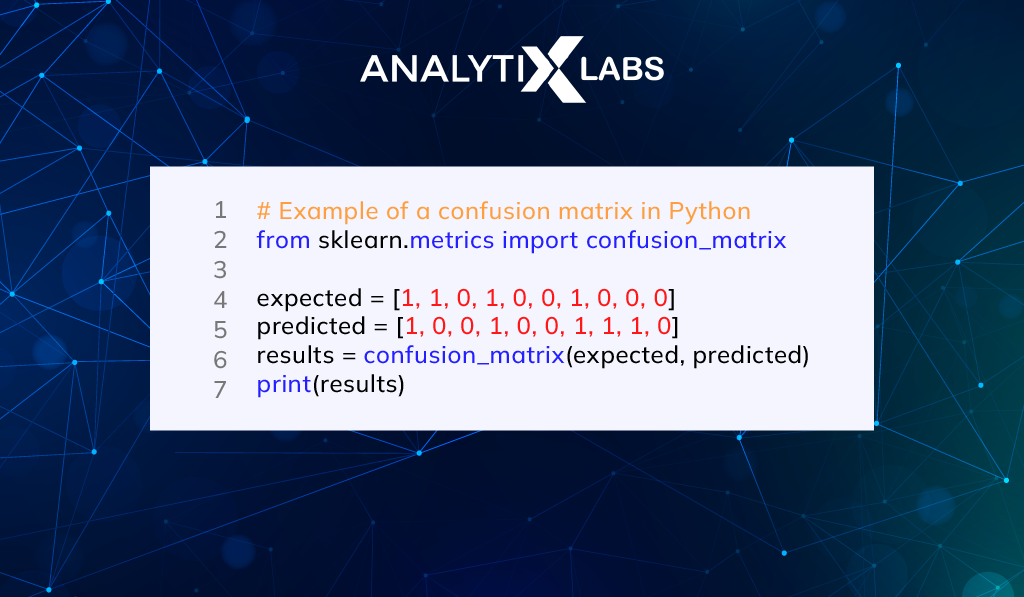
Running this example prints an array of confusion matrices that summarises the outcomes for the fictitious 2-class problem.
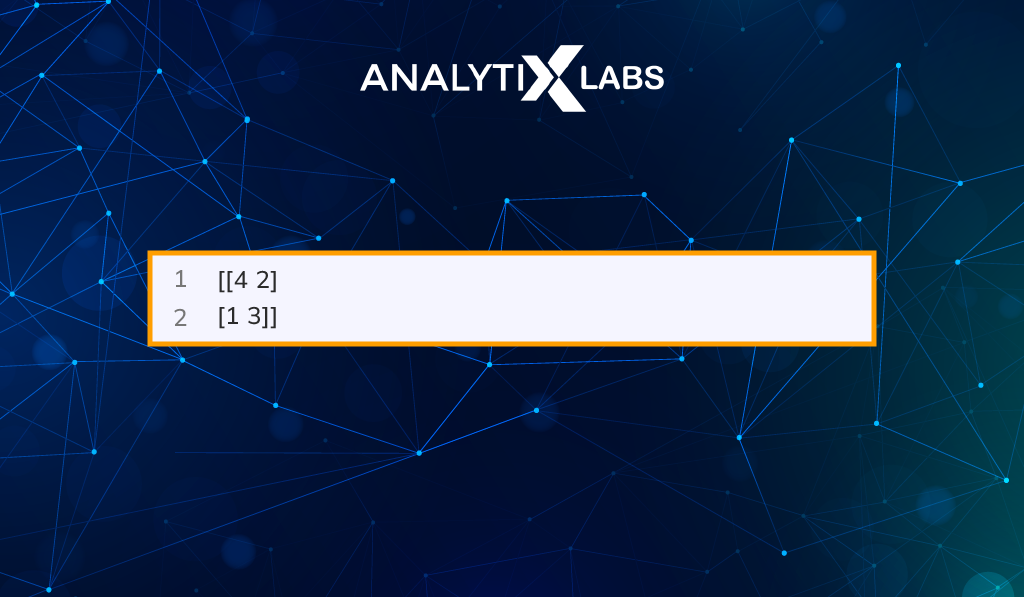
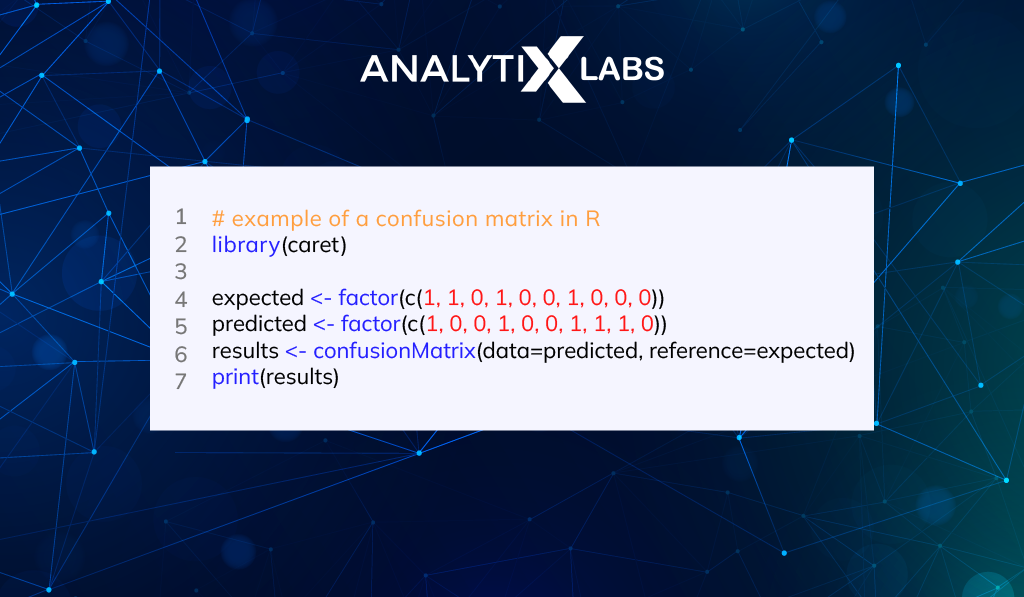
Example Confusion Matrix in R with Caret
A confusion matrix can be computed using the R Caret library for machine learning.
The confusionMatrix() function will generate a confusion matrix a list of expected values and a list of predictions from your machine learning model. It returns the result as a thorough report for the confusion matrix in R. The results can then be printed out and analyzed.
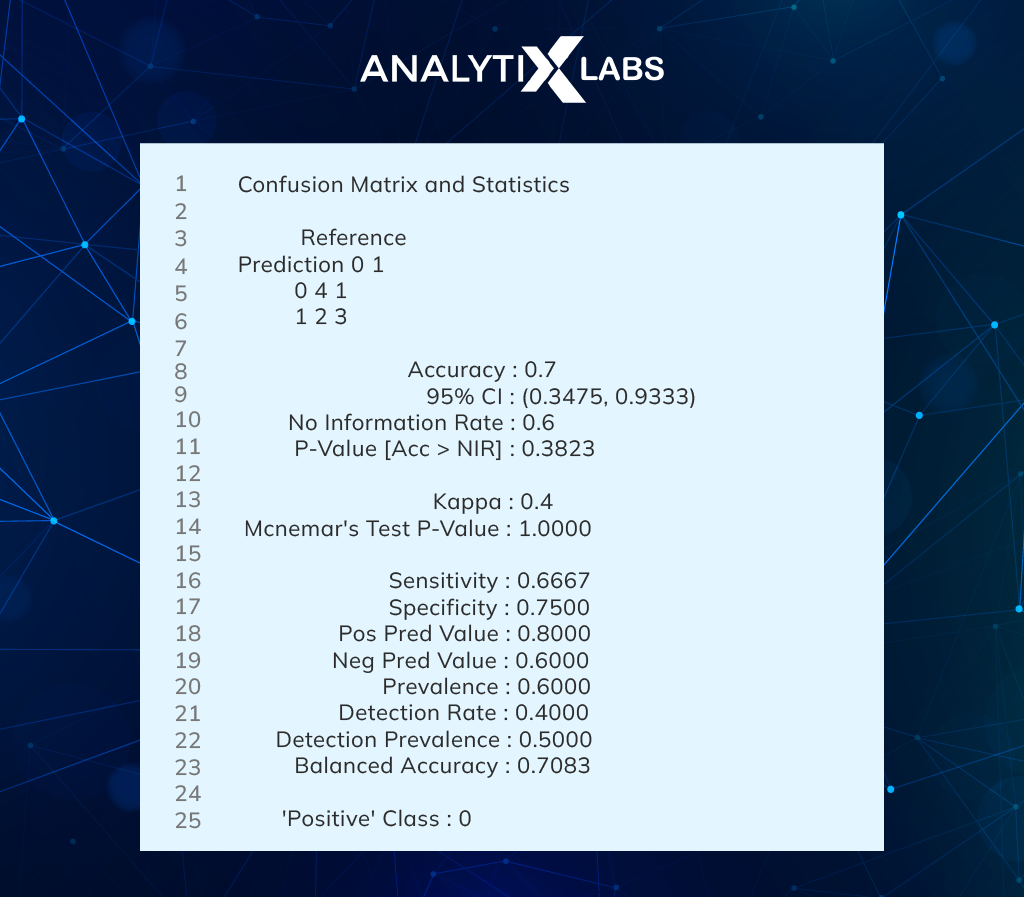
When this example of confusion matrix in R is run, a confusion matrix report and associated statistics are computed and printed.
FAQs
1. What is confusion matrix in ML?
The efficiency of a classification model is evaluated using a N x N matrix termed a confusion matrix, where N is the total number of target classes. The machine learning model’s predicted goal values are compared to the actual goal values in the matrix. This gives us a comprehensive understanding of the effectiveness of our classification model and the types of mistakes it is committing.
A 2 x 2 matrix with 4 values is what we would have for a binary classification problem:
Now let’s interpret the matrix: Positive or negative values can be assigned to the target variable.
- The columns show the target variable’s real values.
- The rows display the target variable’s anticipated values.
2. Why is it called a confusion matrix?
Karl Pearson created the confusion matrix in 1904. The phrase “Contingency Table” was used. The confusion matrix’s underlying idea is relatively straightforward, but the vocabulary used to describe it can be a little perplexing . Therefore it is known as the confusion matrix.
The name derives from the fact that it is simple to determine whether the system is merging two classes (i.e. commonly mislabeling one as another).
This brings us to the end of understanding what is confusion matrix in machine learning, its applications, and need in the data world. Good luck.
Additional Resources to Read