When talking about Data Science, tools like Python and R take center stage since these enable data mining and model development. Simultaneously, Hadoop and AWS are also talked about in dealing with big data and model deployment. However, there is one tool that has repeatedly helped Data Scientists perform simple and complicated data analysis – Microsoft Excel or Excel. This is why any data scientist will, hands down, agree that learning about Excel interview questions can be rewarding at any juncture of your career.
While there are many advanced data analytics and statistical tools, Excel is ubiquitous, even when it is just a spreadsheet.
It isn’t easy to imagine any interview that involves you dealing with data and not having questions about MS Excel, and there is a reason for it.
MS Excel has limited capability compared to other more advanced and sophisticated data-related tools. But it is agile, easy to access, and serves multiple purposes.
You should be well versed with the common Excel interview questions for any job role that requires you to operate on or analyze data. You will learn about the most critical Excel interview questions and answers in this article.
Once you are done going through these questions, including the advanced Excel interview questions, it will help you understand the nature of the questions that are asked.
Let us first expand on our knowledge of Excel and its use and then explore the crucial Excel-based interview questions.
Excel for Data Analysis, Storage, and Management
Before preparing for the questions about Excel, you must know its uses. The most crucial benefits of Excel are –

- Data Storage in Ranges and Tables
- Data Cleaning
- Conditional Formatting
- Sorting and Filtering
- Quick Analysis
- Pivot Tables
- Visualization
- Data Validation
- What-if Analysis
- Regression & Statistical Tests
- Lookup Operations
- Summary Statistics
- Collaboration
Now that you know about the uses, let us start exploring the crucial questions about Excel – starting with how to prepare for an interview.
How to Prepare for an Interview?
The first part is getting your resume ready and applying for a job. You can use our detailed guides on writing resumes:
- How to write a resume for a data scientist job role?
- How to write a resume for a data analyst job role?
- How to write a resume for a machine learning job role?
When appearing for any interview, there are specific steps that you must follow to improve your chances of selection.
The crucial one is optimizing your resume to pass through the ATS, i.e., Application Tracking System. This process includes understanding what kind of keywords or job descriptions you should add to your resume so that an automated filtering system like ATS does not filter out your resume.
Consequent steps include:
- Step 1: Understand the Job Description
- Step 2: Be Prepared for the tools and techniques
- Step 3: Identify Plausible Questions
- Step 4: Listen Effectively to the interviewer
- Step 5: Be succinct and honest in your responses
- Step 6: Engage with the interviewer in two ways to process
- Step 7: Ask for Feedback
Lastly, once the interview is done, you must ask for feedback. This will help you identify your weak points that you can work on to make yourself a better candidate.
Now let’s start with the Excel interview questions that you must know.
Top 50 Excel Interview Questions & Answers
An Excel test for interview consists of a mix of several questions that range from beginner to advanced level.
We have bifurcated the article into three major sections – beginners, intermediate, and advanced Excel interview questions categories.
Excel interview questions for beginners
Interviewees often fumble in the most basic of questions when answering interview questions about Excel skills because, often, such questions are ignored. Therefore let’s first start with the basic questions.
Common Excel interview questions revolve around basic definitions and understanding common Excel functionalities .

All the answers are written in a comprehensive tone in order to educate you about the concepts and functions of Excel. These are not the exact way to answer any interview questions. Rather, these answers will help you understand the concept you must discuss when the respective questions are asked.
1. What are spreadsheets?
Ans. The Excel interview questions can start from the basic definition of what MS Excel Is all about.
A spreadsheet is a computer application that allows users to store, arrange, sort, and analyze data. Data is stored in a tabular format in a spreadsheet; to do so, a spreadsheet has a page with a grid structure.
The grid comprises a rectangular box called a cell, the smallest unit in a spreadsheet formed when the rows and columns intersect. Each cell has a unique address. In a single spreadsheet workbook, data can be stored in multiple worksheets. MS Excel is one of the most common spreadsheet applications.
2. What is a cell address in Excel?
Ans. As mentioned above, a cell is the intersection of rows and columns. In Excel, the column index is alphabets starting from ‘A’ while the row index is numbers that start from 1.
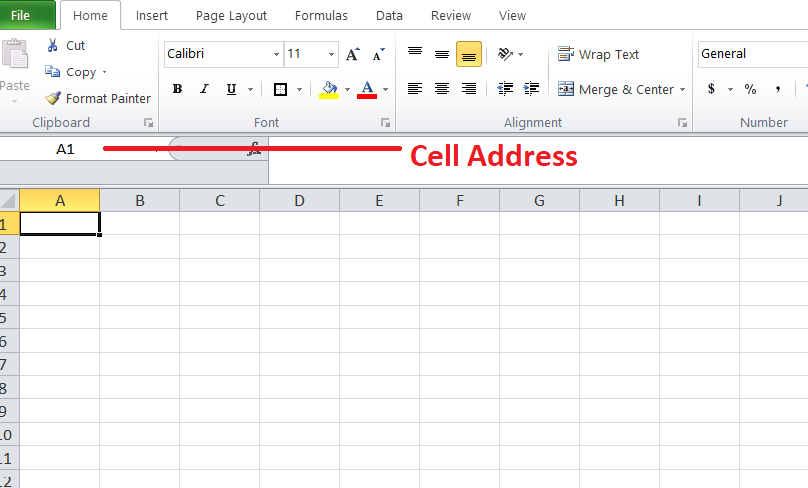
Each cell is provided with an address that combines the column letter and row number. For example, the first cell in a worksheet is always ‘A1‘, signifying the cell where the first column and first row intersect.
3. What is Ribbon?
Ans. In MS Excel, Ribbon refers to the primary interface at the top of the window. The Ribbon contains the most critical commands that users can access directly. The various functionalities in the Ribbon are grouped and divided into tabs such as File, Home, Insert, and View.
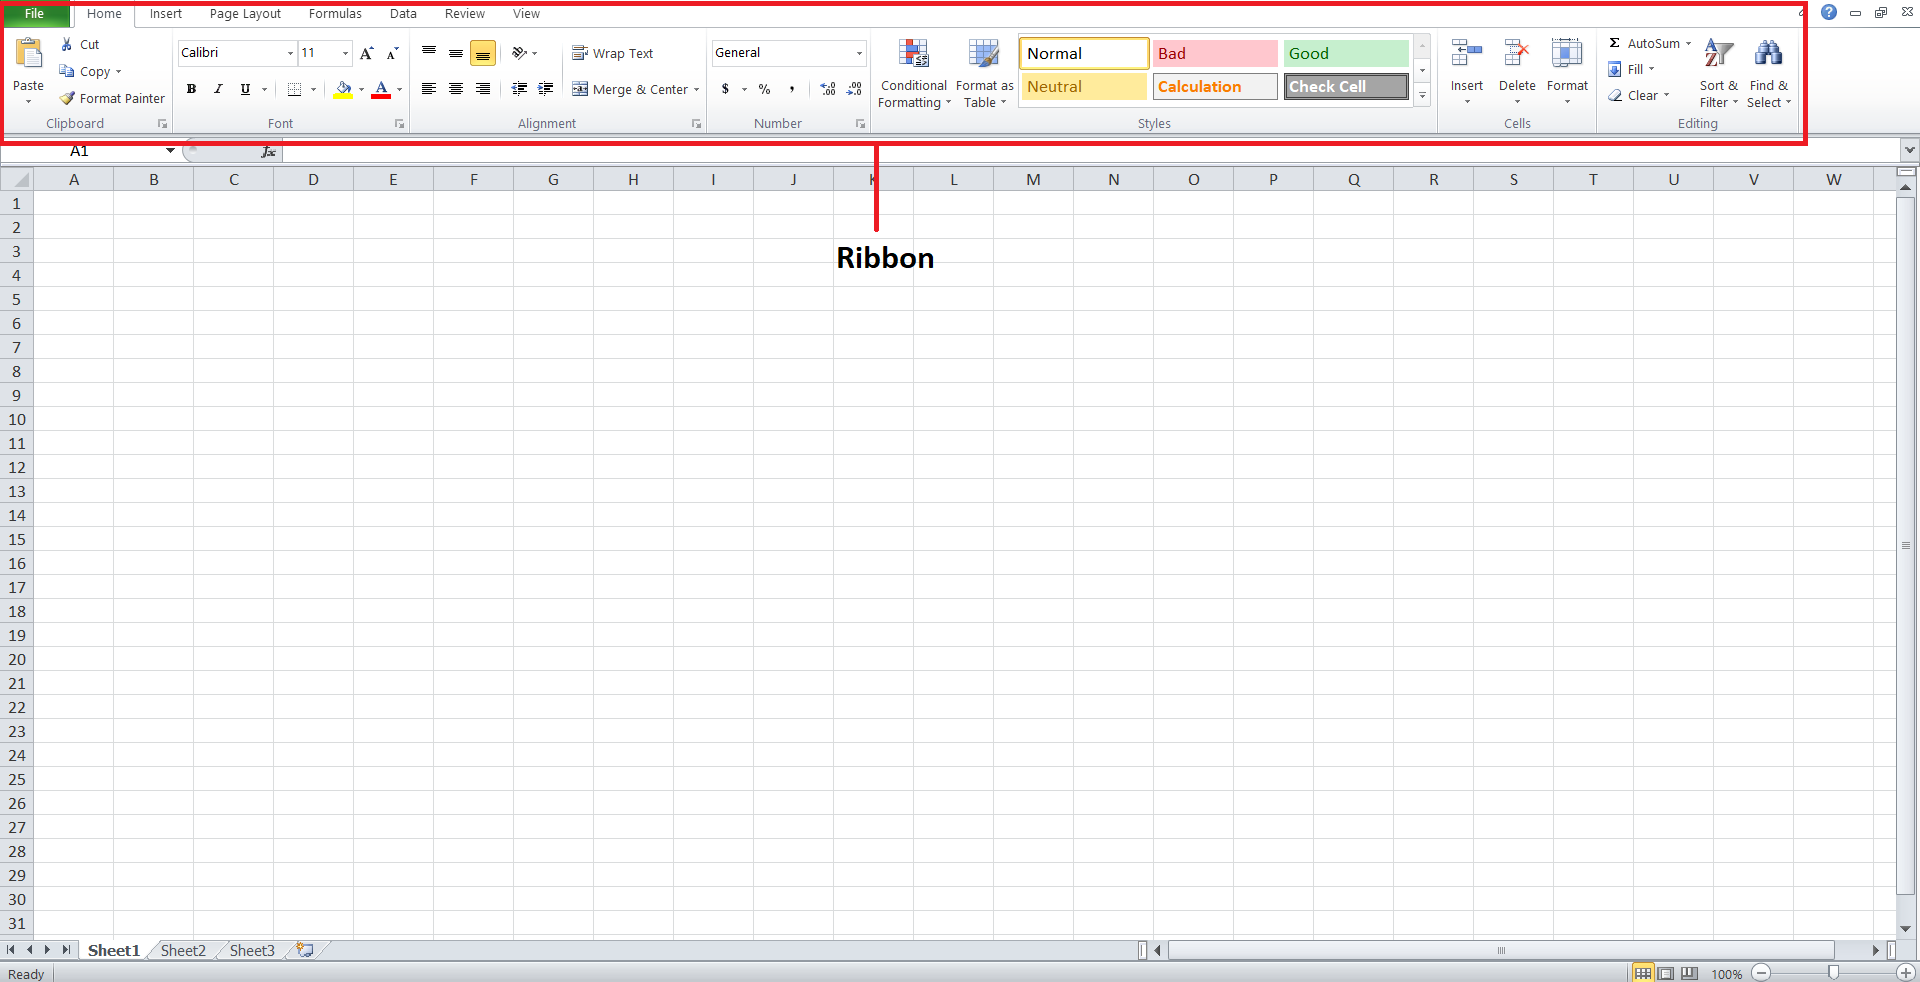
More tabs may appear depending on the work you are performing. You can customize the Ribbon and add/ remove the tabs and the functionalities it holds by right-clicking on the Ribbon and then selecting the “Customize Ribbon” option.
4. What are the data formats and file formats available in Excel?
Ans. There are eleven data formats for storing data and six primary file formats for saving the workbook.
Standard data formats include:
- Number
- Currency
- Date
- Percentage
- Text.
Common data formats for saving a workbook include:
- Excel workbook (.xlsx)
- Excel macro-enabled workbook (.xlsm)
- Excel binary workbook (.xlsb)
- Template (.xltx)
- Template (code) (.xltm)
- XML data (.xml)
5. What is the shortcut to move from one page to another?
Ans.
- On Windows OS: CTRL + PgUp to move to the previous sheet, while to move to the next sheet, you can use CTRL + PgDown.
- On Mac OS: Option + Right arrow key to move to the next worksheet in a workbook, while to move to the previous sheet, use the Option + Left arrow key.
6. Explain a few useful functions in Excel.
Ans. There are hundreds of functions in Excel that help you to analyze and manipulate data. A few common functions include the following-
- Logical Functions – IF, AND, TRUE, FALSE
- Date and Time related – NOW(), WEEKDAY(NOW()), DATEVALUE(),
- VLOOKUP and INDEX -MATCH
- Pivot tables
- Conditional Formatting
7. What is the difference between Formula and Function in Excel?
Ans.
| Formula | Function |
|---|---|
| In Excel, a Formula acts like an equation where the user types to perform some operation. The calculation can be of any type depending on the user’s choice. | A Function performs a predefined calculation and is built-in in Excel. |
| One can manually type a formula, but doing so every time there is a need to perform a calculation is time-consuming. | Working with functions is faster and more comfortable. |
| Example- A1 + A2 + A3 + B1 + A2 + B3 | Example- =SUM(A1:B3) |
8. Explain the difference between COUNT, COUNTBLANK, and COUNTA.
Ans. If you need to count the cells that do or don’t contain data, then the count family of functions helps.
- COUNT function returns the number of cells containing numeric data. It ignores cells with blanks, special characters, and strings
- COUNTA counts all the cells that do not have blanks
- COUNTBLANK, as the name suggests, only counts blank cells
9. How do you link a cell in Excel to different files and websites?
Ans. Adding links to external files and websites is crucial in Excel, especially to refer to various sources of information or data in the spreadsheet. To add links, you can use the hyperlink feature that you can access by right-clicking on a cell and selecting “Hyperlink”.
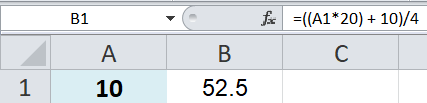
10. Write the formula for the following – Multiply the value in cell A1 by 20, add 10 to the result, and divide it by 4.
Ans. You must follow the PEDMAS precedence in Excel when writing such a formula. Here the answer would look be-
=((A1*20) + 10)/4
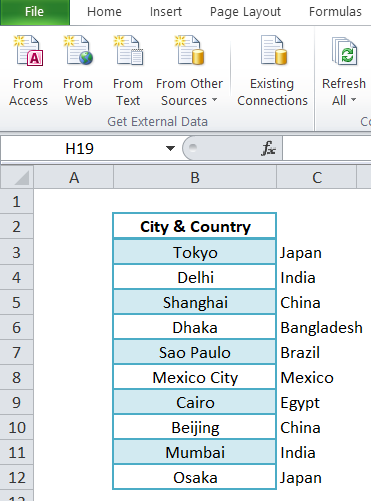
11. How can you split a column into two or more columns?
Ans. You can use the ‘Text to Columns’ functionality in the Data Tools section in the Data Tab. The data can be split based on a delimiter or fixed width.
If you select delimiter, you can mention the delimiter based on which the column will be split. In the example below, I split the city and country using ‘-‘ as the delimiter.
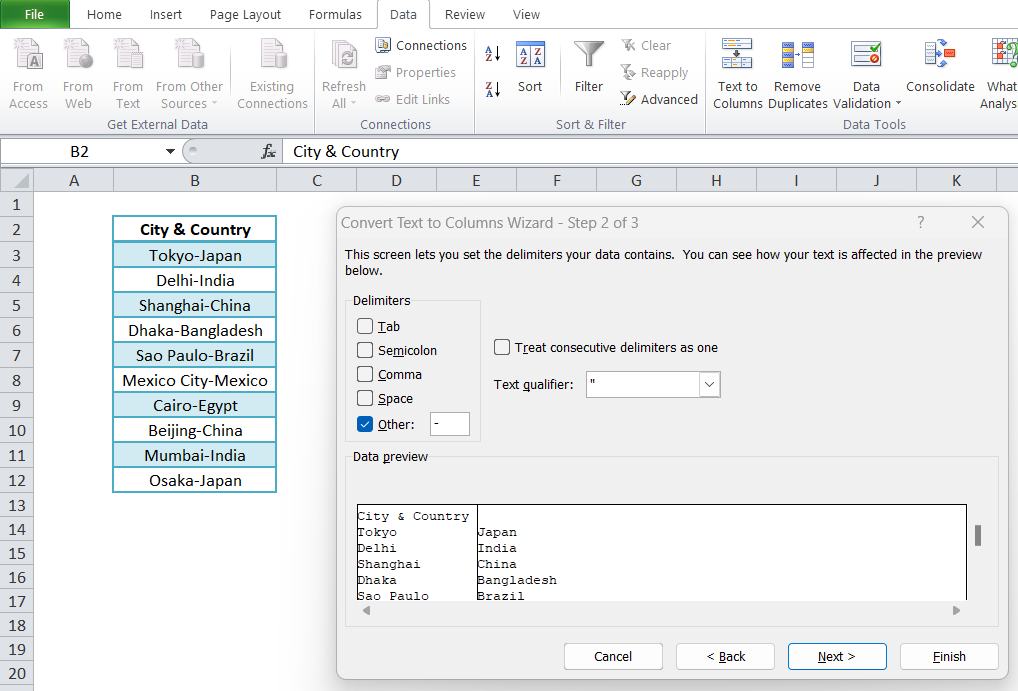
Once done, the data is split into two columns.
12. What does the meaning of the red triangle at the top right of a cell?
Ans. The red triangle at the top right indicates that a comment is associated with that cell. The user can read the full comment by hovering their mouse over it.
13. Can you disable automatic sorting in pivot tables?
Ans. Yes, it can be done. Follow the below steps to disable automatic storing in pivot tables-
- Step 1: Have a pivot table
- Step 2: Click on the down arrow at the right of the column label cell.
- Step 3: Select the ‘More Sort option’
- Step 4: Select ‘More Options’ (in the bottom left corner)
- Step 5: Deselect ‘Sort Automatically’
- Step 6: To dismiss the Sort Dialog Box, click on ‘OK’
14. What are the three workbook protection types in Excel?
Ans. There can be a few questions regarding safeguarding the workbook in Excel interview questions.
The three ways to protect an Excel workbook are:
- Password protection for opening a workbook
- Protection against manipulating sheets such as adding, deleting, hiding, and unhiding sheets
- Protection against changing window size or position
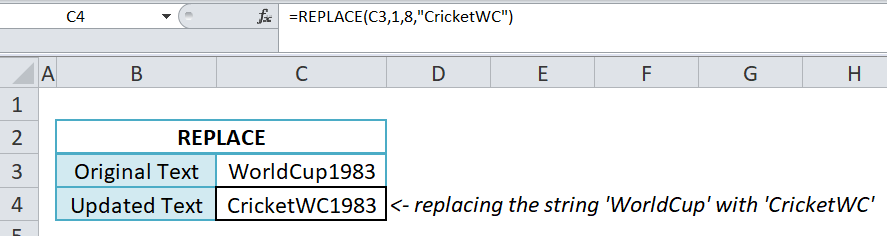
15. What is the difference between the SUBSTITUTE and REPLACE functions?
If one or more instances of old text are to be replaced with new text in a string-based cell, then the SUBSTITUTE function is used.
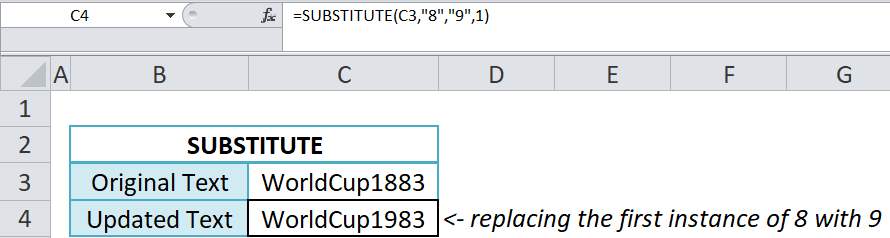
On the contrary, REPLACE allows the user to swap a part of a string with another string. See the example below for more understanding.
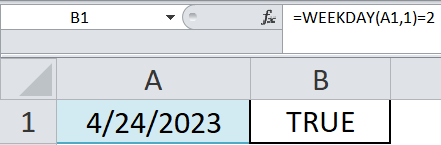
16. Determine the day of the week. Check if the date 4/24/2023 in cell A1 is Monday or not.
Ans. The WEEKDAY() function can provide the day of the week for a particular date. It counts the weekday from Sunday. For checking if the date 4/23/2023 is Monday (the second day of the week), the formula would be WEEKDAY(A1,1)=2.
17. List the benefits of using the formula in an Excel sheet.
Ans. There are numerous benefits of using the formula in Excel, such as-
- Time-Saving: Formulas can be used to automate calculations. Once a formula is established, you can easily and repeatedly change the input values without manually calculating the new values.
- Accuracy: A formula is much more accurate, especially for complex calculations.
- Consistency: A formula can be applied to different datasets ensuring that the calculation remains consistent.
- Flexibility: The formula can be easily modified, allowing the user to accommodate new data, scenarios, etc.
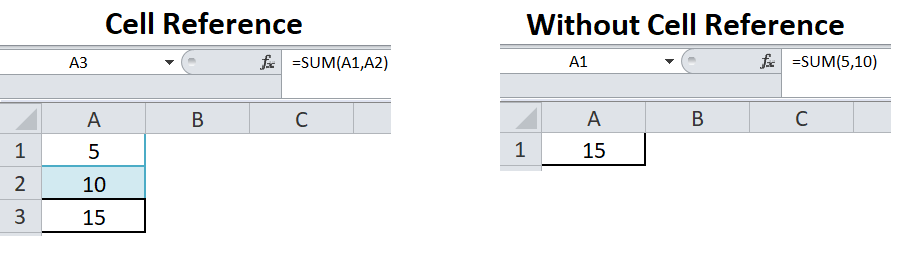
18. How is cell reference useful in the calculation?
Ans. Cell referencing is especially helpful when writing formulas. Rather than manually providing the data to the formula, it’s always better to direct Excel to the cell or range of cells from where the data is being collected. The location, therefore, is referred to as ‘cell reference’.
For example, for taking the sum of 5 and 10, it’s better to take some of the cells A1 and A2 that contain 5 and 10, respectively.
19. What is the difference between Relative cell referencing and Absolute cell referencing?
Ans. There are a few significant differences between the two types of cell referencing mechanisms-
| Relative Cell Referencing | Absolute Cell Referencing |
|---|---|
| Depending on the cell’s designation, the cells referenced in a formula change when the formula is copied from one cell to another. | Irrespective of the cell’s designation, there is no change to the cell references when the formula is copied. |
| The default type of referencing. | The user must add a $ symbol before the column address, column row, or both to convert the referencing from relative to absolute. |
| Example- =COUNTIF(A2:A14,A2) | Example- =COUNTIF($A$2:$A$14,A2) |
20. What are the steps to create a Pivot Chart in Excel?
Ans.
- Step 1: Have a pivot table and select any cell in the pivot table
- Step 2: Go to the Insert tab
- Step 3: Select the ‘Pivot Chart’ option
- Step 4: Choose a suitable chart for the pivot data
Intermediate Excel Interview Questions
As the basic interview questions about Excel skills are out of the way, let’s focus on some core functions and operations of Excel.

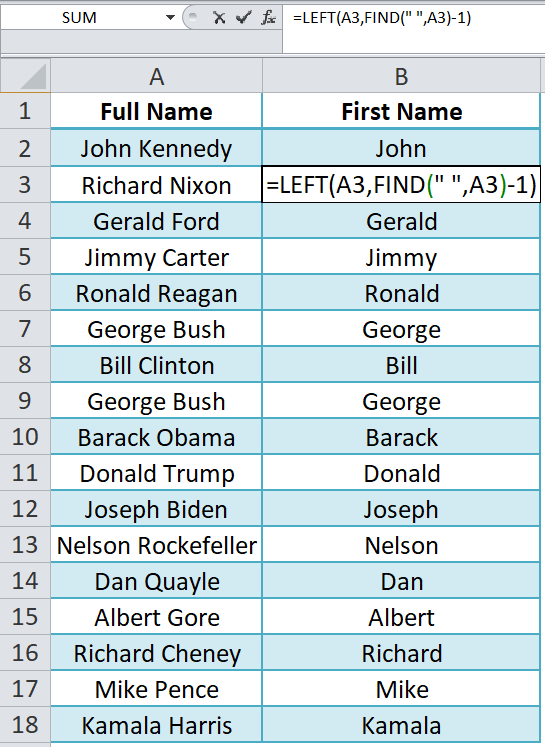
21. How Do You Extract the First Name from a Full Name in the following table?
Ans. There are two ways to extract the first name.
- The first is to use the text-to-column function in the Data Tab and split the string using
as the delimiter. - The second method would be to use a combination of FIND and LEFT functions.
The FIND function will find the position of the delimiter that separates the first and last names.
The LEFT function will use the FIND function output (which provides the position from where the last name starts). As the output will also include the space from the delimiter, we will subtract 1 from the output of FIND.
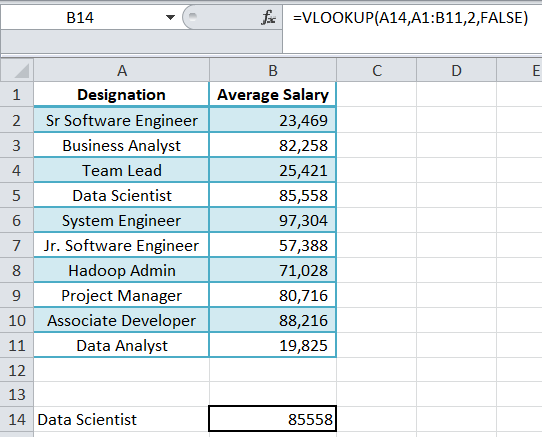
22. What is the VLOOKUP function? How to use it?
Ans. Disclaimer : This is a very important function and almost a must-ask Excel interview question.
The VLOOKUP up function allows the user to lookup for certain information in a column. It returns a value from a different column in the same row, extracting the required data.
The syntax of VLOOKUP is-
VLOOKUP(value, table, col_index, [range_lookup])
where,
- value: the value you are looking for
- table: The table from where the information will be retrieved. The column having the values you are looking for should be the first in the table.
- col_index: The column’s index from where the information you are trying to retrieve is present.
- range_lookup – Use FALSE for an exact and TRUE for an approximate match.
For example, I am looking for the value – ‘Data Scientist’ and want to retrieve the average salary. In such a scenario, the VLOOKUP function will look like this-
23. What is the difference between VLOOKUP and LOOKUP functions?
Ans. In Excel interview questions, you are often tested on the knowledge of the lookup functionalities; therefore, you must prepare for questions of such type.
VLOOKUP requires the column having the lookup values to be in the leftmost column in the table and returns the value to the right of it, i.e., in a left-to-right manner.
On the contrary, LOOKUP allows users to look for data in a row or column and return values from another row or column.
As LOOKUP gives more flexibility to the user, it’s easier to use than VLOOKUP.
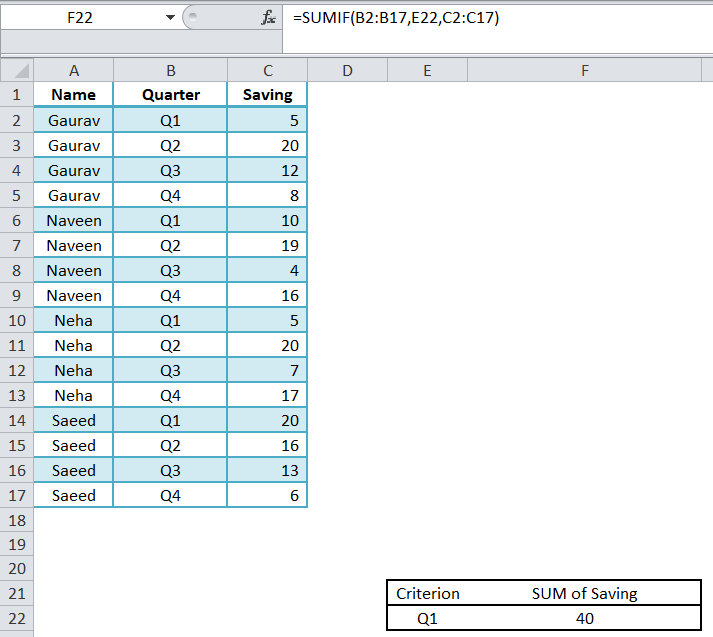
24. How to use the SUMIF() function in Excel?
Ans. The SUMIF function allows users to sum cells if a specific condition is met. For example, if you want to find the sum of all the savings done in Q1, then the formula would be something like-
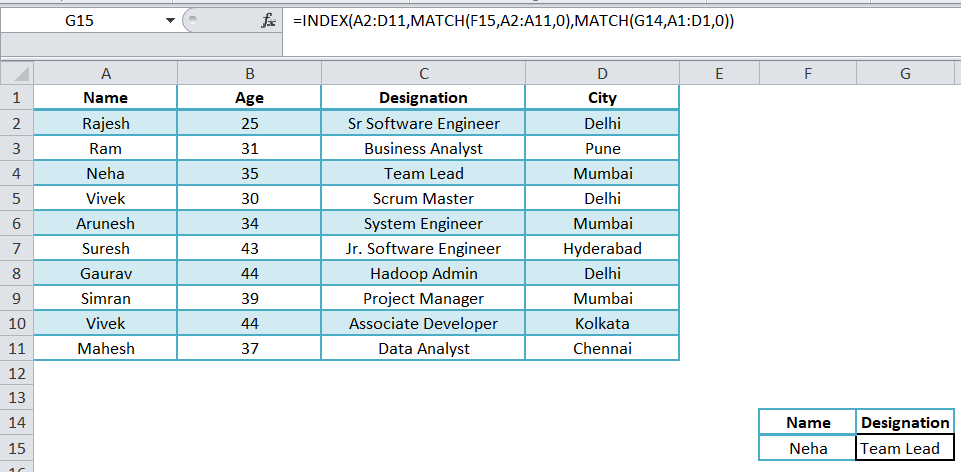
25. Find the designation of Neha using the INDEX-MATCH function.
Ans. The INDEX function, along with the MATCH function, can be used in the following way–
26. How to find duplicate values in a column?
Ans. There are broadly two ways of finding duplicates in the data.
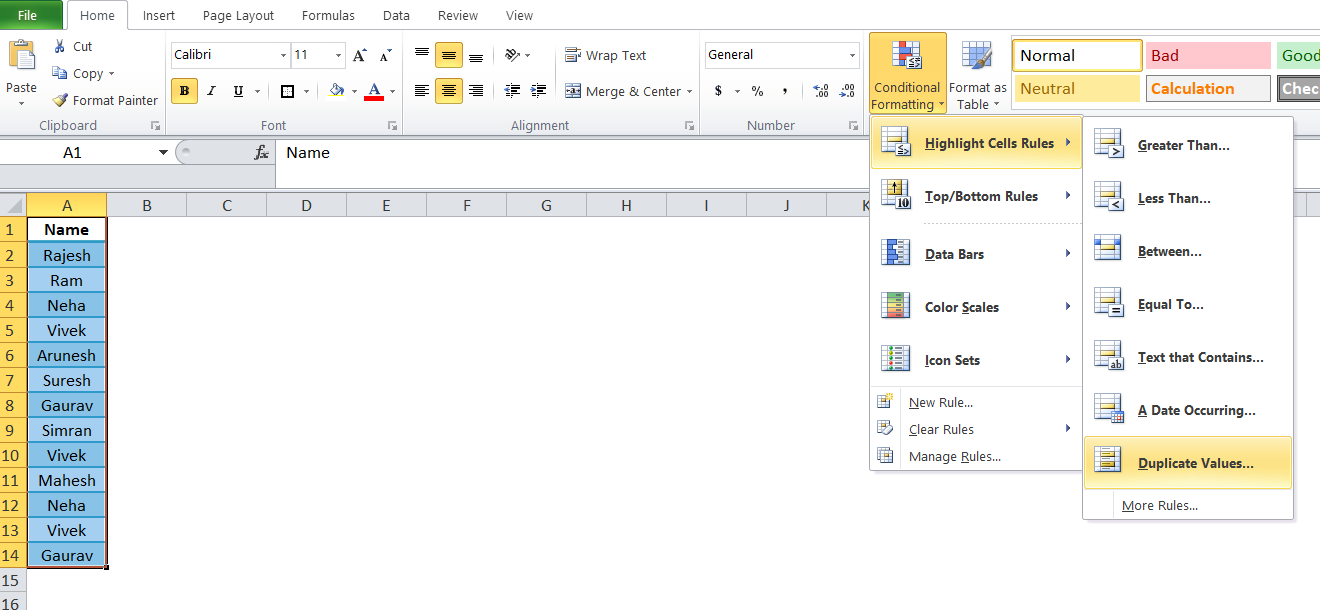
Method 1: Conditional Formatting
- Step1: Select data
- Step 2: Go to the Home tab, and under the Styles section, select Conditional Formatting
- Step 3: Select Highlight Cells Rules 🡪 Duplicate Values
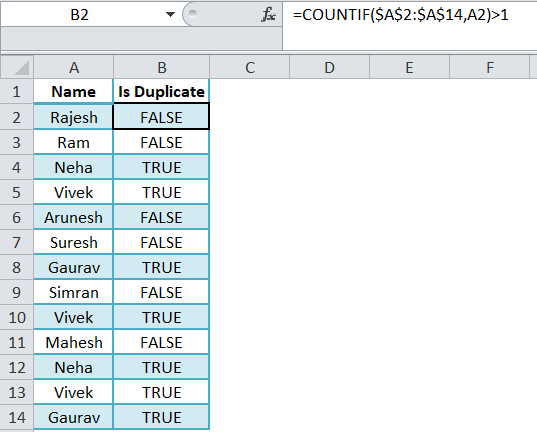
Method 2: COUNTIF
Write a COUNTIF function to check if a value has a count of more than 1.
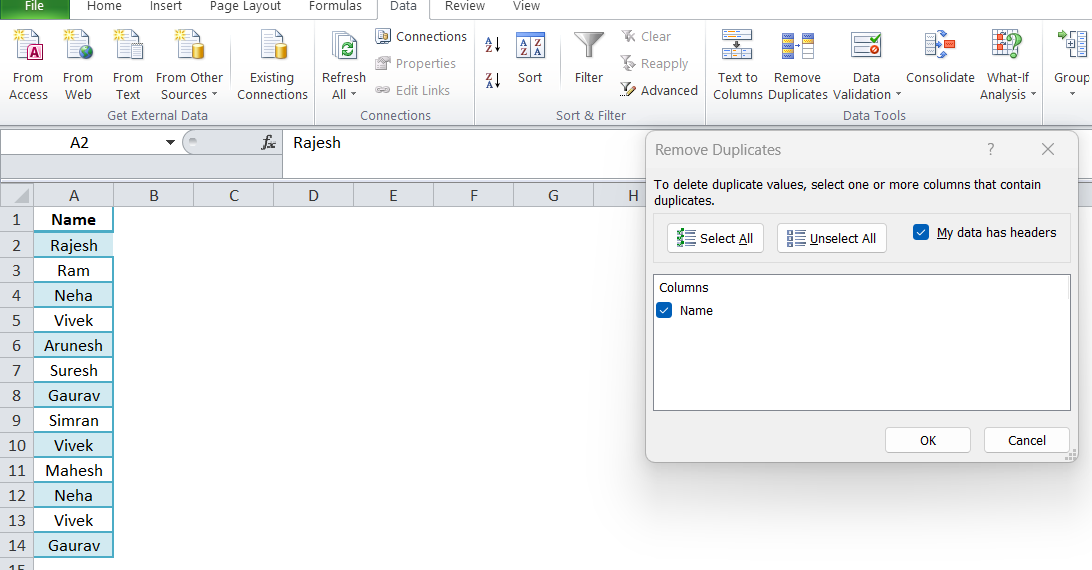
27. How will you remove duplicate values in a range of cells?
Ans. You can use the Remove Duplicates function in the Data Tools section under the Data tab in the Ribbon. You first need to select the data in question and then use this functionality.
28. What are the wildcards available in Excel? Explain with examples.
Ans. Wildcards work with text data and help you filter them. There are three types of wildcards in Excel.
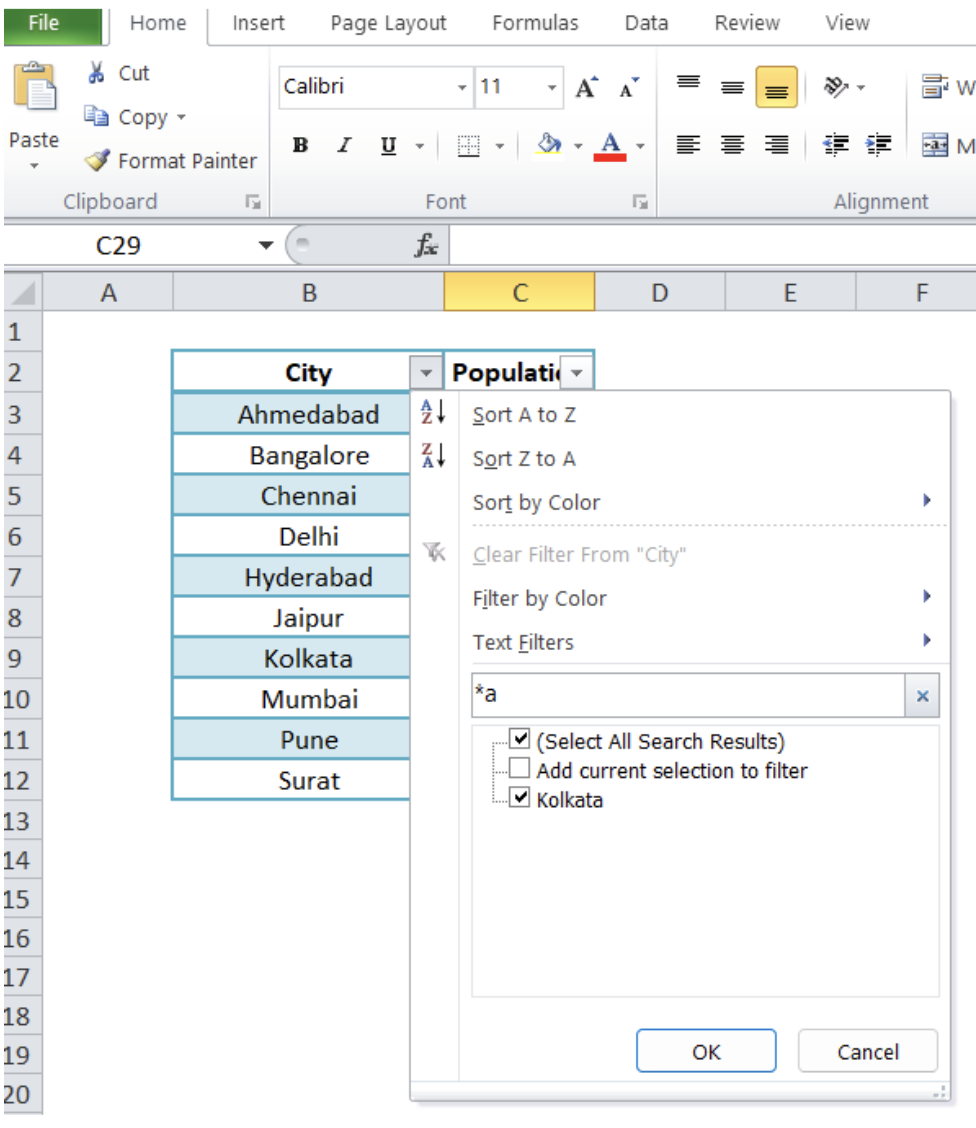
- Type 1: * (Asterisk)
This wildcard refers to any number of characters before or after it.
For example, if you want to filter all the cities whose names end with “a”, you can use “*a” in the filter section.
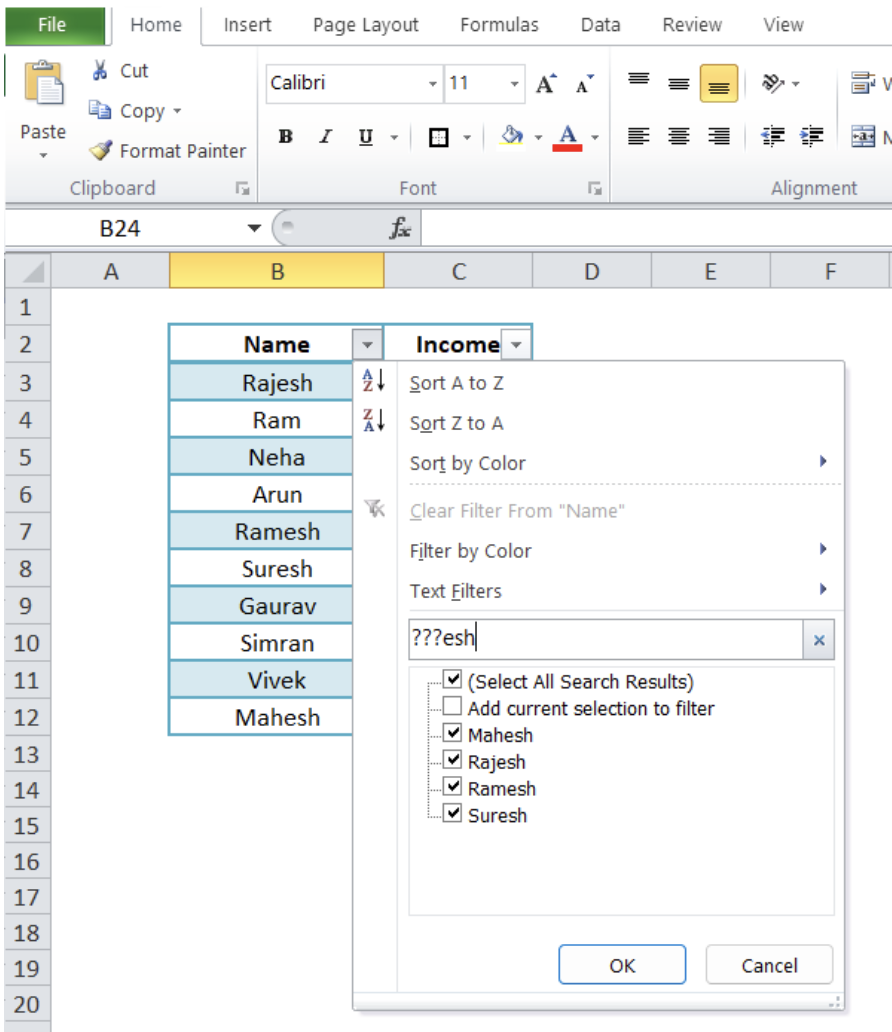
- Type 2:? (Question mark)
It is used to represent one single unknown character. If required, you can use multiple ?? when filtering text. For example, if you want filter names where the letters are ‘esh’ after three characters, you will use ‘???esh’ in the filter section.
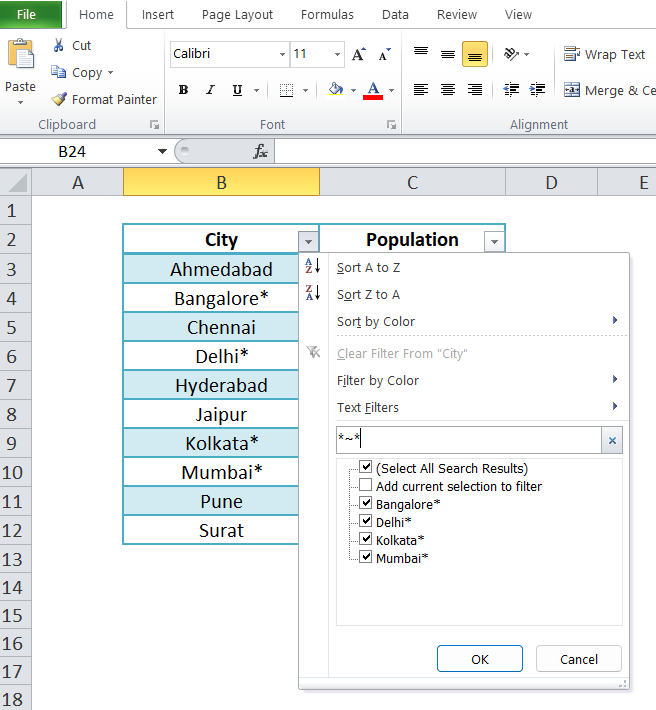
- Type 3: ~ (Tilde)
If a wildcard in the data needs to be filtered, then we use . For example, we want to filter all those city names with a * at the end of their name (maybe signifying that data for these cities is not yet updated). In such a case, we will mention ‘** in the filter section.
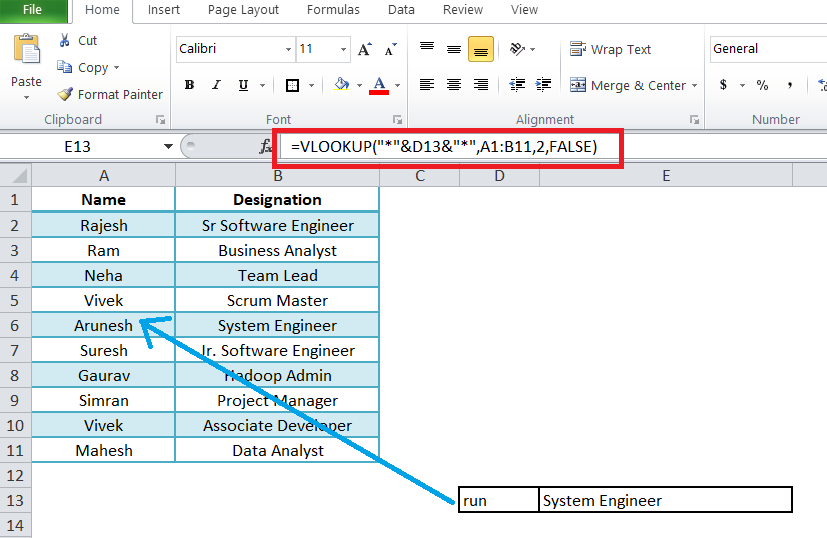
29. How do you use wildcards with VLOOKUP?
Ans. Wildcards come in handy when you are performing look-ups and are not sure about the look-up value. For example, you want to know the designation of someone in the Data Science department.
However, you are not sure if their name was Varun or Arunesh. Therefore you want to detect the designation of that person whose name has ‘run’ somewhere in the middle of their name.
In the example below, I have exactly done that-
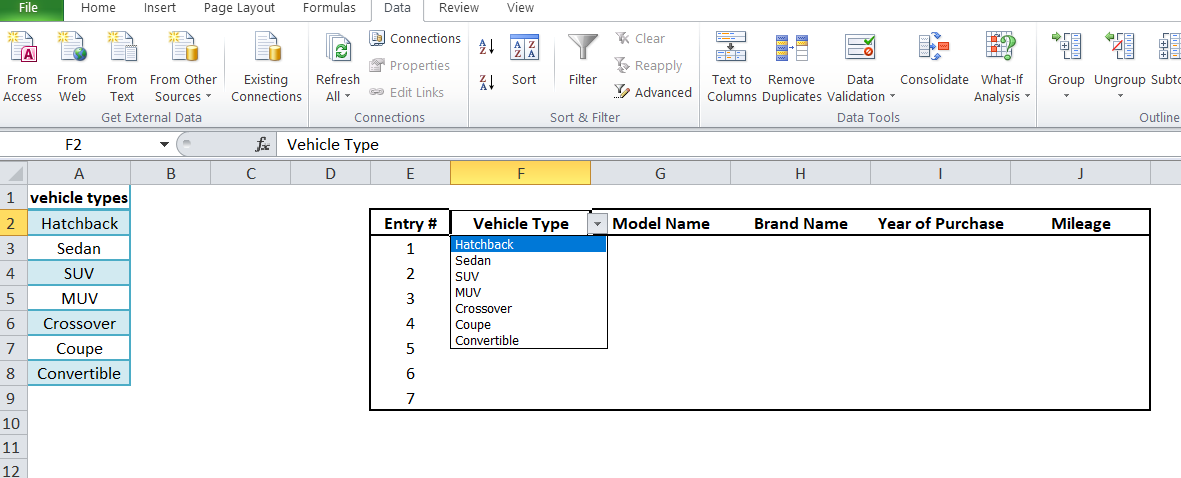
30. What is Data Validation? Illustrate with an example.
Ans. Data validation allows the creator of the Excel workbook to restrict the type of values the user can enter in a cell or range of cells. Data Validation can give the user a list to choose from when providing input to a cell.
For example, you want the user to select any one type of vehicle type when providing information about their vehicle. To do so, you perform the following steps-
- Step 1: Create a list of acceptable values in Excel
- Step 2: Select the cell that is the column header where the drop-down is to be provided
- Step 3: Go to the Ribbon and click on the Data tab.
- Step 4: From the Data Tools section, select Data Validation
- Step 5: Go to Settings 🡪 Allow 🡪 List
- Step 6: Select the array where the list of acceptable values is provided
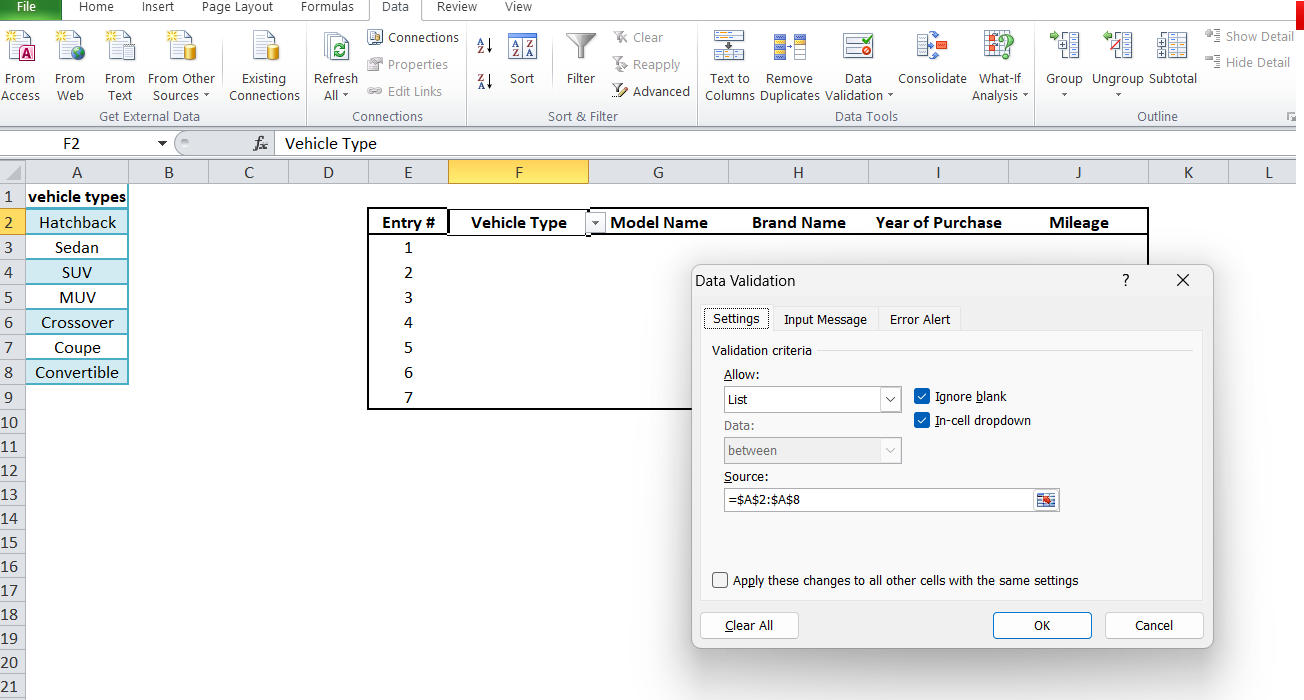
You now will have a drop-down based on the array you provided.
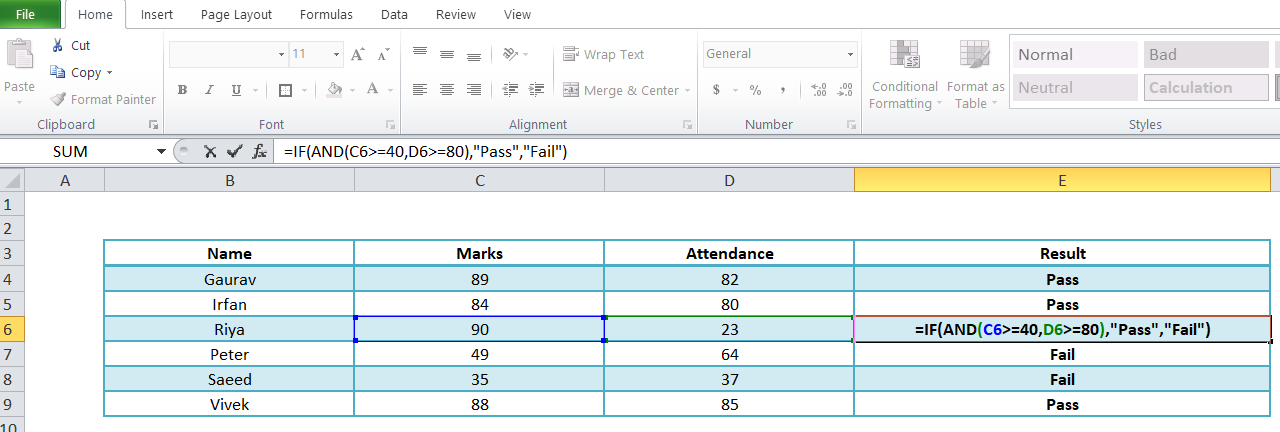
31. You have a table with marks and college students’ attendance. Provide each student with a pass or fail status. The student will be considered passed only when marks >= 40 and attendance >=80. The table with the required information is given below-
| Name | Marks | Attendance |
|---|---|---|
| Gaurav | 89 | 82 |
| Irfan | 84 | 78 |
| Riya | 90 | 23 |
| Peter | 49 | 64 |
| Saeed | 35 | 37 |
| Vivek | 88 | 85 |
Ans. Excel provides the IF function that returns a value if a condition is true; else, it returns another value if false. We have considered two conditions here; therefore, AND can be used along with the IF function.
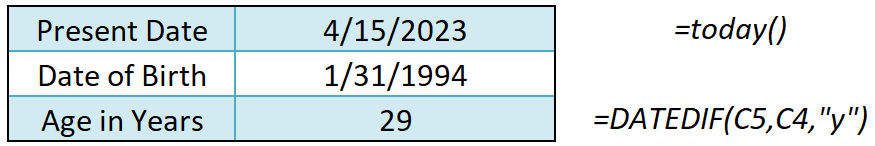
32. Which function will you use to calculate your age (in years) from the present date?
Ans. Excel provides DATEDIF functions that can provide the number of whole days between a start and an end date. By passing “y” in the unit argument of the function, you can get the difference between two dates in years.
For example-
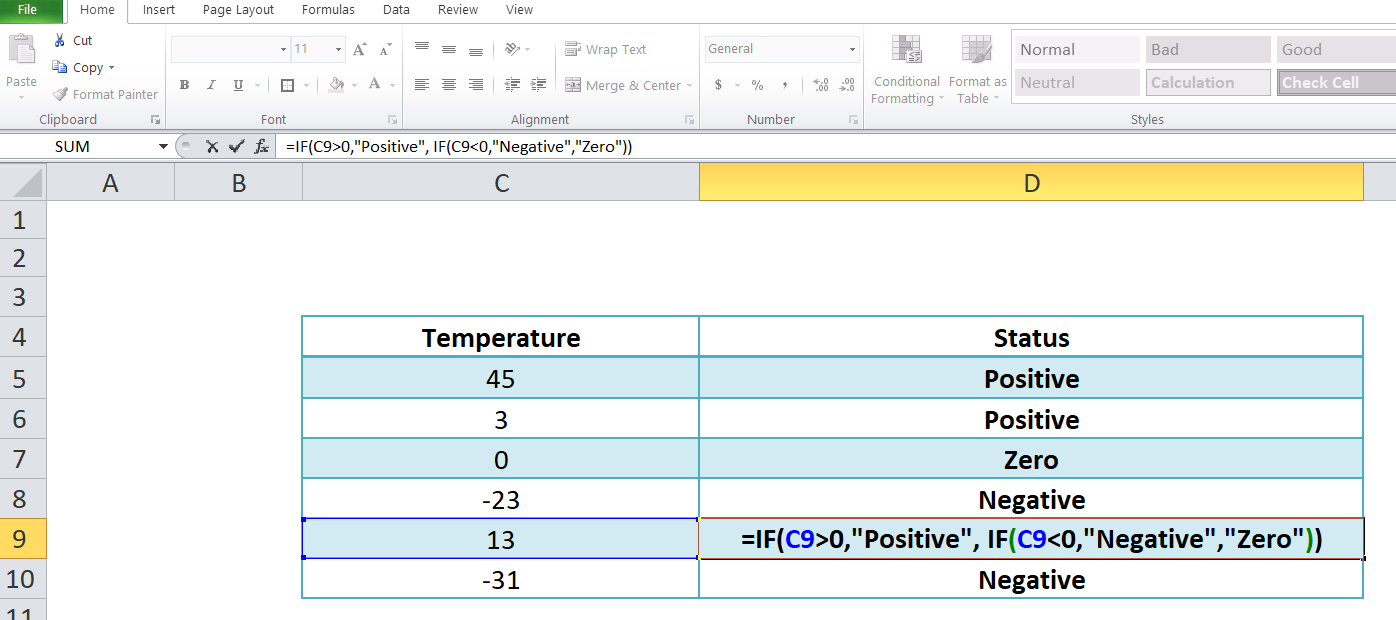
33. Explain nested IF statements used in Excel with an example.
Ans. The function IF is required to be nested when there are multiple conditions to be checked.
In nested IF, in place of the ‘value if false’ argument, another IF function is provided such that if the first true condition is not met, the next IF condition is evaluated, and so forth.
You can nest multiple IF statements together, and a simple example would be identifying if a value is positive, negative, or zero.
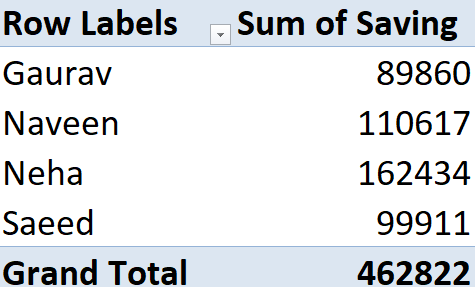
34. Refer to the table below and find the total saving of each person using the pivot table.
| Name | Quarter | Saving |
|---|---|---|
| Neha | Q1 | 21,968 |
| Gaurav | Q1 | 19,274 |
| Saeed | Q1 | 30,050 |
| Naveen | Q1 | 22,907 |
| Neha | Q2 | 58,961 |
| Gaurav | Q2 | 10,151 |
| Saeed | Q2 | 35,270 |
| Naveen | Q2 | 35,846 |
| Neha | Q3 | 48,210 |
| Gaurav | Q3 | 31,663 |
| Saeed | Q3 | 11,429 |
| Naveen | Q3 | 13,028 |
| Neha | Q4 | 33,295 |
| Gaurav | Q4 | 28,772 |
| Saeed | Q4 | 23,162 |
| Naveen | Q4 | 38,836 |
Ans.
Step 1: Select the table
Step 2: In the Insert tab, click on ‘PivotTable’
Step 3: In the PivotTable Fields window, drop the Name column in the ‘Rows’ section and the Saving column in the ‘Values’ section
Step 4: Click on the drop-down of the ‘Saving’ column in the Values section to select the summary statistic as sum (ignore the step if ‘sum’ is already selected)
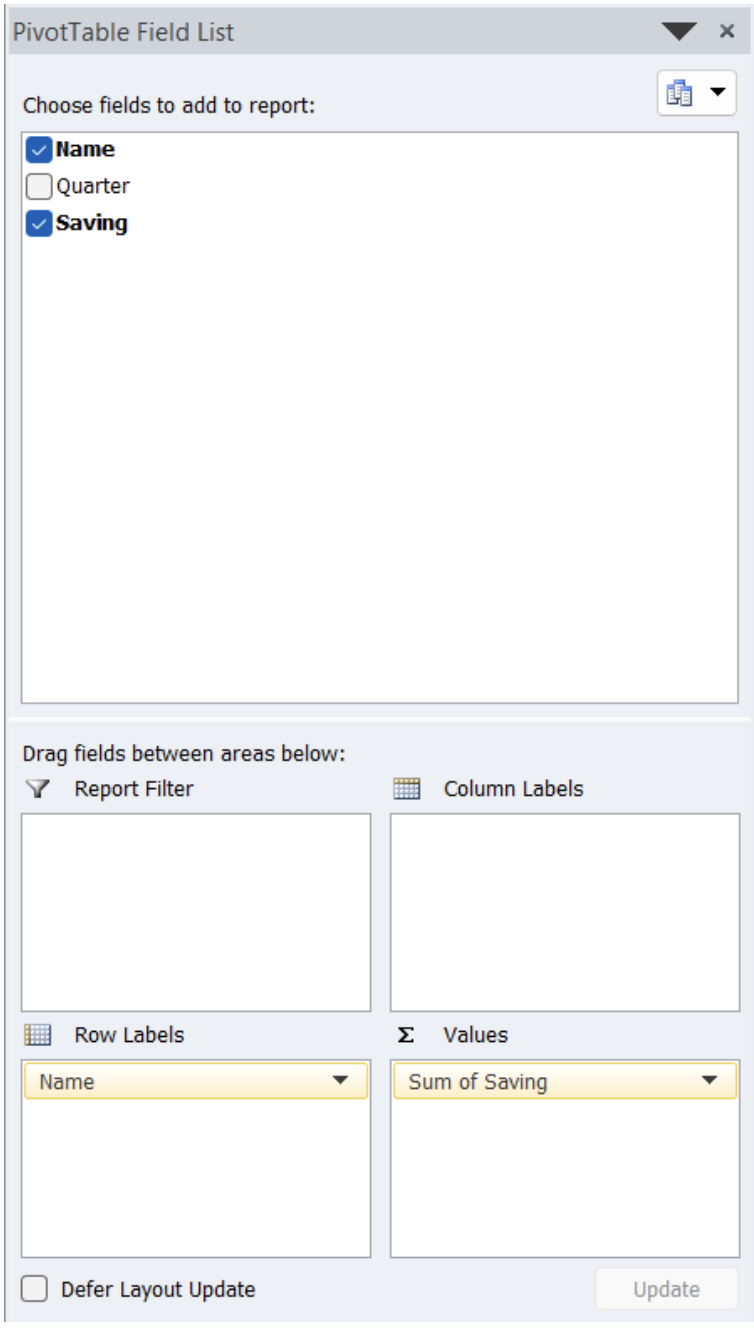
Once done, you will get the desired information.
35. What is the shortcut to applying a formula to an entire column in Excel?
There are multiple ways through which a formula can be applied to the entire column. The three most common methods are-
- Method 1: double-click on the bottom right corner of the cell. This will apply the formula to the entire column.
- Method 2: Select the cell containing the formula and select the rest of the column by pressing CTRL + SHIFT + DOWN. Press CTRL + D to apply the formula to the selected columns.
- Method 3: If the cell with the formula is the first cell of a column, select the whole column by clicking any cell in the column and pressing CTRL + SPACE. You can now apply the formula to the entire column by pressing CTRL + D.
Advanced Excel Interview Questions
Now, Let’s explore a few advanced Excel interview questions involving VBA and other crucial but less-talked-about functionalities.

36. Explain Macro in MS Excel.
Ans. In Excel, a Macro can be created for iterating over tasks. Macros are used to come up with customized repetitive functions and instructions. There are two ways of creating Macros; they can be either written or recorded.
37. What macro languages are available in MS Excel?
Ans. There are two macro languages in Excel viz. XLM and VBA (Visual Basic Applications). While the earlier versions of Excel used XLM, the newer versions use VBA, which was introduced in Excel 5.
38. How to create a Pivot Table using multiple sources of data?
Ans. To create a pivot table from multiple worksheets, you first need to ensure a common column in both tables, as this will act as the primary key for the first and the foreign key for the second table.
Once done, you can create a relationship between the two tables and build the pivot table.
Relationships between tables can be created by clicking on Data > Relationships > Manage Relationship > Create Relationship > Select the Primary and Foreign Key > OK
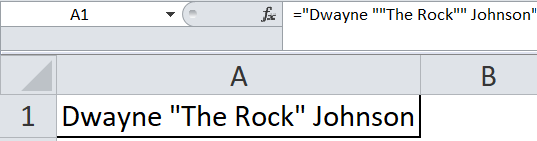
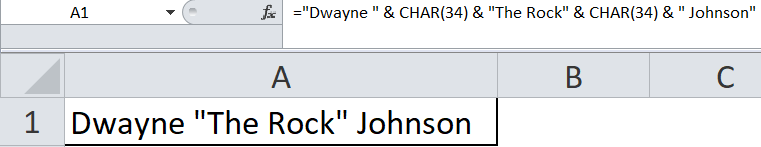
39. How do you create a string/formula containing double quotes in Excel? Construct the following string in an Excel: Dwayne “The Rock” Johnson
Ans. You can escape a character using an additional double quote. Escaping a character allows Excel to treat the particular character as text.
For example:
You can also use the character function-
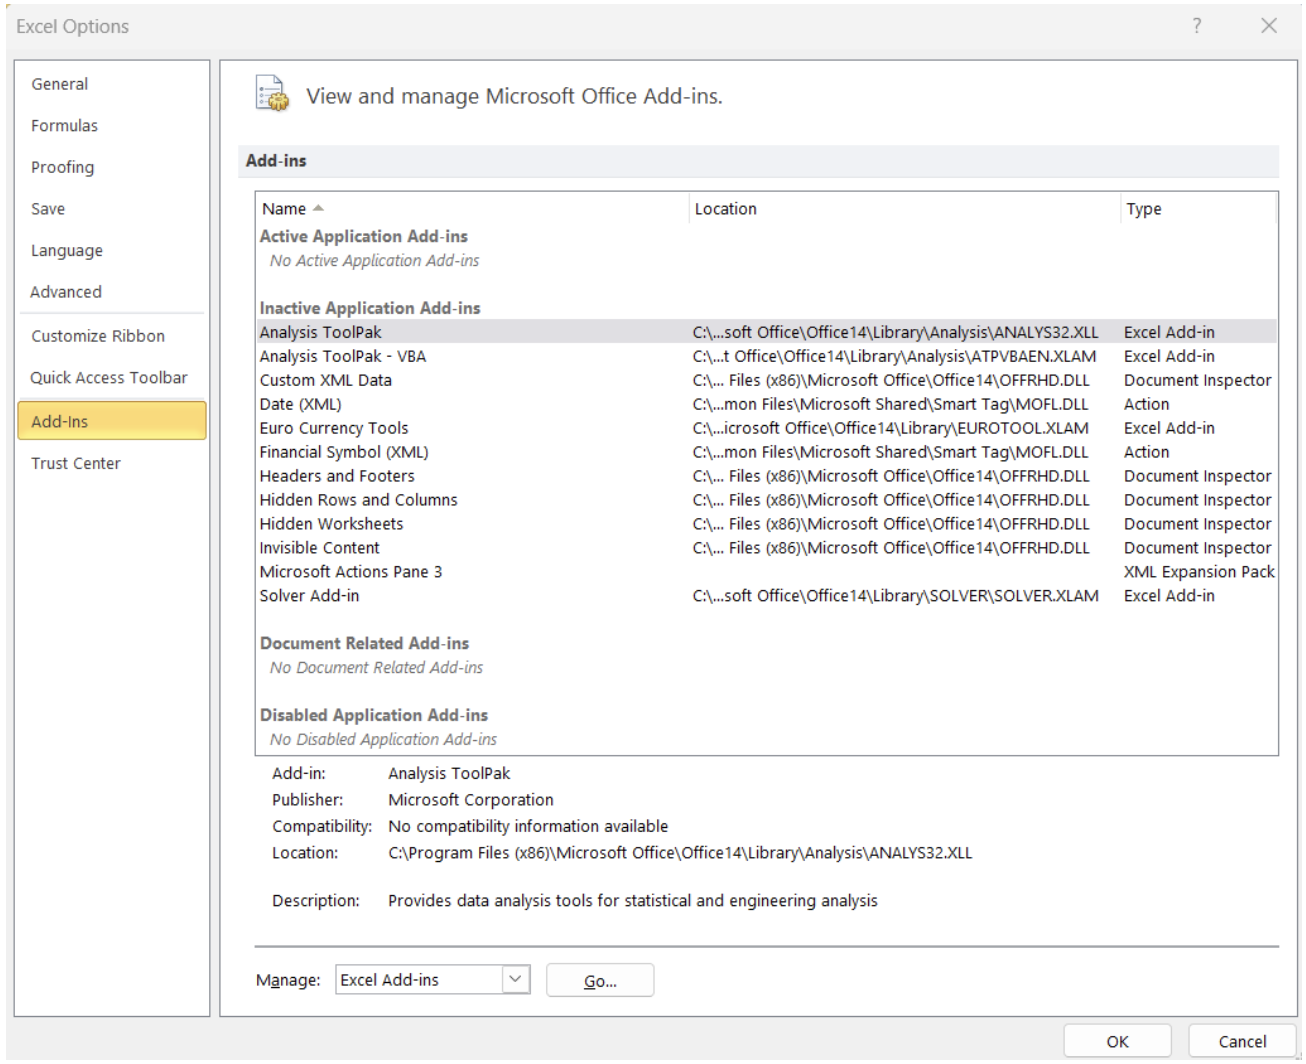
40. How to calculate descriptive statistics using the Data Analysis ToolPak in Excel?
Ans. To add the Analysis ToolPak complete the following steps-
- Step 1: Click on File Tab
- Step 2: Select options
- Step 3: Select ‘Add-ins’ from the sidebar menu
- Step 4: Select ‘Analysis ToolPak’
- Step 5: Click ‘Go’ and then ‘OK’
Once the add-in is installed, select the ‘Data Analysis’ function from the Analysis section available in the Data tab.
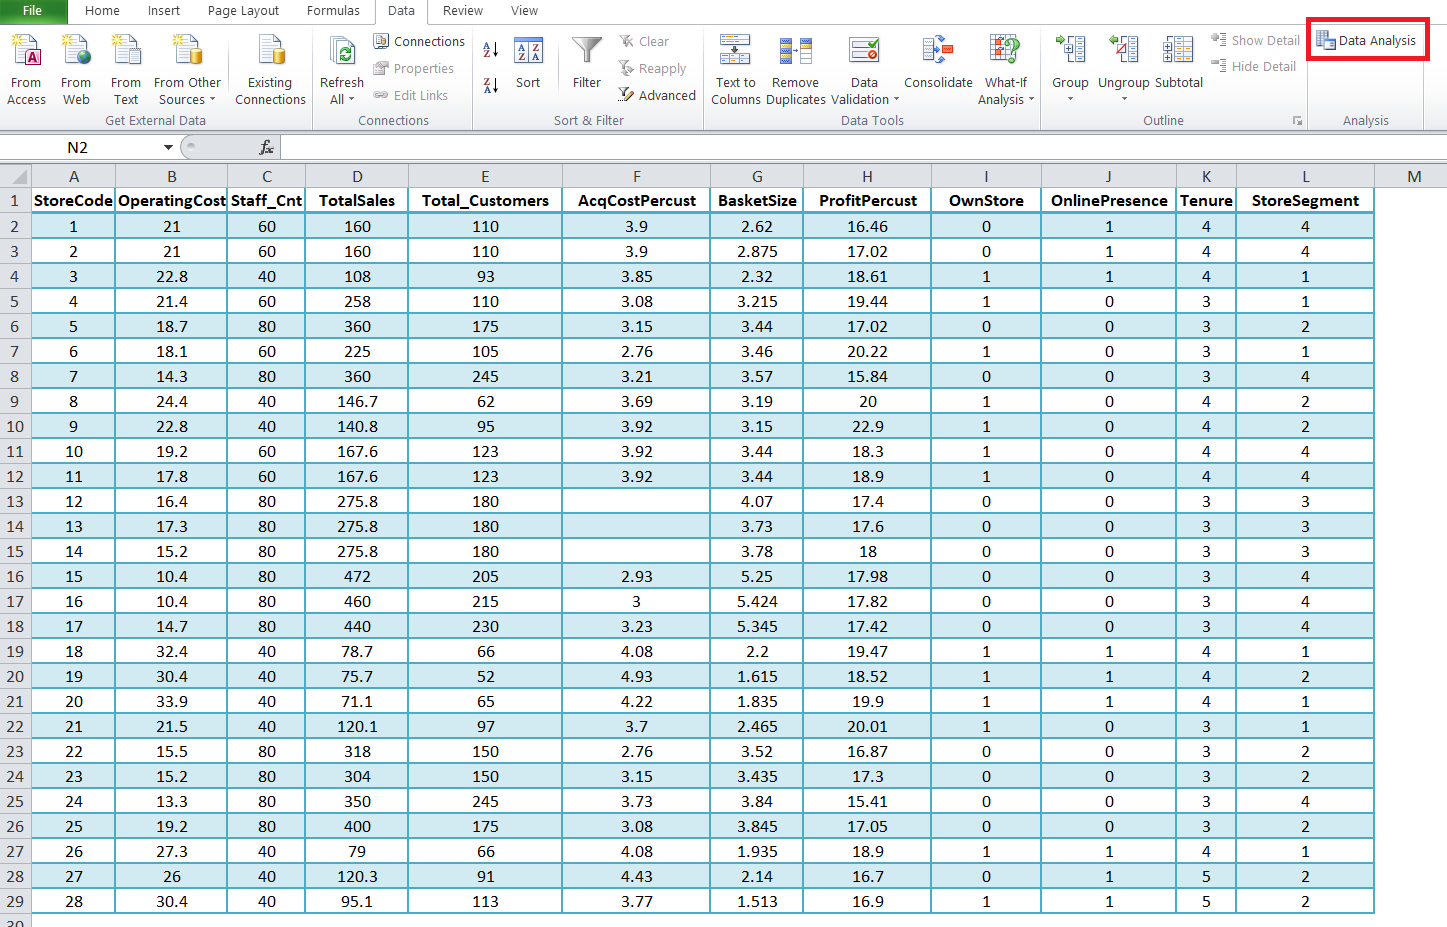
Once done, select ‘Descriptive Statistics’.
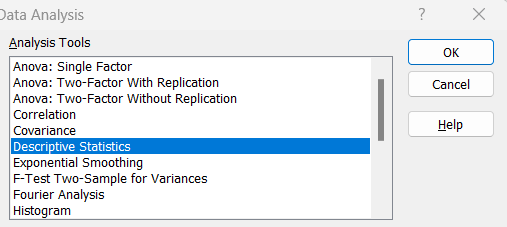
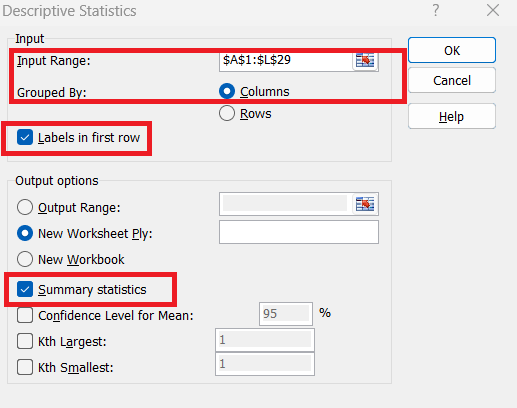
Perform the following to come up with the summary statistics table-
- Select data using ‘Input Range’
- Select ‘Columns’ in ‘Grouped By:’
- Tick ‘Label in first row’ if you have column names in the data in the first row
- Tick ‘Summary Statistics’
- Click on ‘OK’.
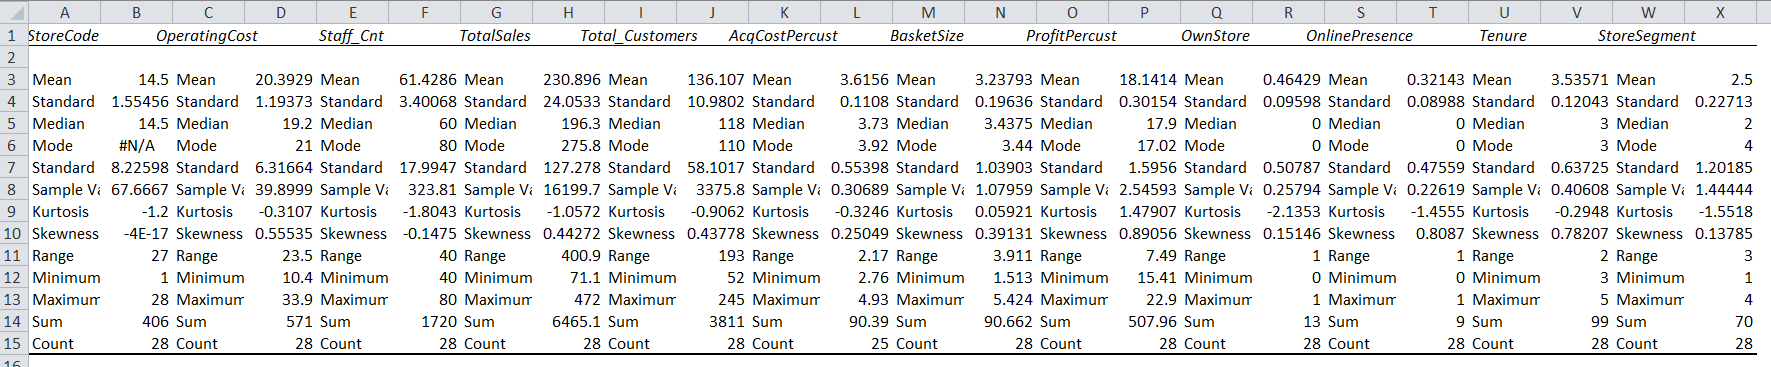
Once done, you will have all the summary statistics in a separate sheet.
Also read: Descriptive vs. Inferential Statistics: Which one is better?
41. What is the What-If Analysis in Excel?
Ans. What-if analysis is a tool in MS Excel that allows users to perform mathematical calculations and experiment with data to try and evaluate different outcomes. Such a function helps solve scenario-based questions.
For example, you have a mobile store with 100 mobiles in storage. You sell 40% of mobiles for the lowest price of $100 and a certain 20% for the highest price of $900 and get a profit of $9000. Now using What-If analysis in Excel, you can try out the following scenarios-
- Amount of profit if 30% of mobiles sold for the highest price
- Amount of profit if 50 of mobiles sold for the highest price
- Amount of profit if 60% of mobiles sold for the lowest price
- What % of mobiles should be sold for the highest price for having a profit of $11,000?
- What % of mobiles should be sold for the lowest price for having a profit of $13,000?
To access the What-If analysis in Excel, go to-
Data Tab > What-If analysis > Scenario Manager / Goal Seek / Data Table
42. Is there any difference between a function and a subroutine in VBA?
In MS Excel, there are several differences between functions and subroutines, such as-
| Functions | Subroutines |
|---|---|
| Returns value for the task it is performing. | Doesn’t return the value of the task it is performing. |
| They are known as variables. | They can be recalled in multiple types from anywhere in the program. |
| They are used as formulas in the spreadsheets. | They aren’t directly used as formulas in spreadsheets. |
| They are used to carry out repetitive tasks that return value. | A value needs to be inserted in the desired cell by the user before the results of the subroutine can be fetched. |
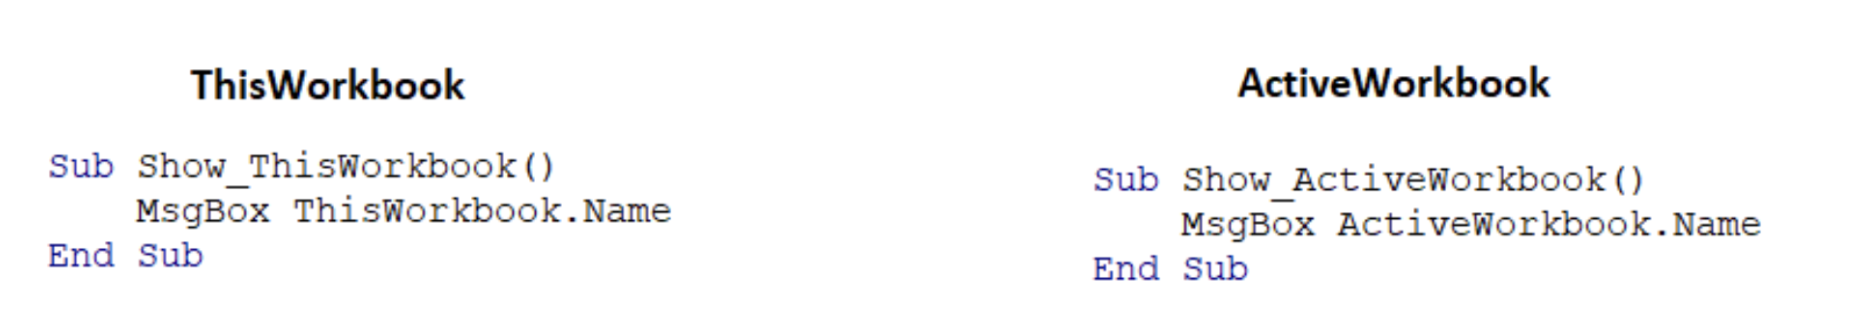
43. Is there any difference between ‘ThisWorkbook’ and ‘ActiveWorkbook’ in VBA**?**
Ans. The main difference between ‘ThisWorkbook’ and ‘ActiveWorkbook’ is that ThisWorkbook indicates the workbook’s name where the code is running from.
On the contrary, as the name suggests, ActiveWorkbook indicates the workbook (out of all the open workbooks) where the code is active.
44. Explain how to debug a VBA code.
Ans. Firstly access the VBA editor by pressing Alt + F8. Once there, you can navigate to the debug options at the top menu to explore various debugging options.
The most used and straightforward way of debugging code is to run it, and you use the F8 key to run the code line after line.
You can add breakpoints using F9, which allows you to terminate the code in a function and check if it works as expected.
45. By writing a code in VBA, check if a number is a prime number.
Ans. 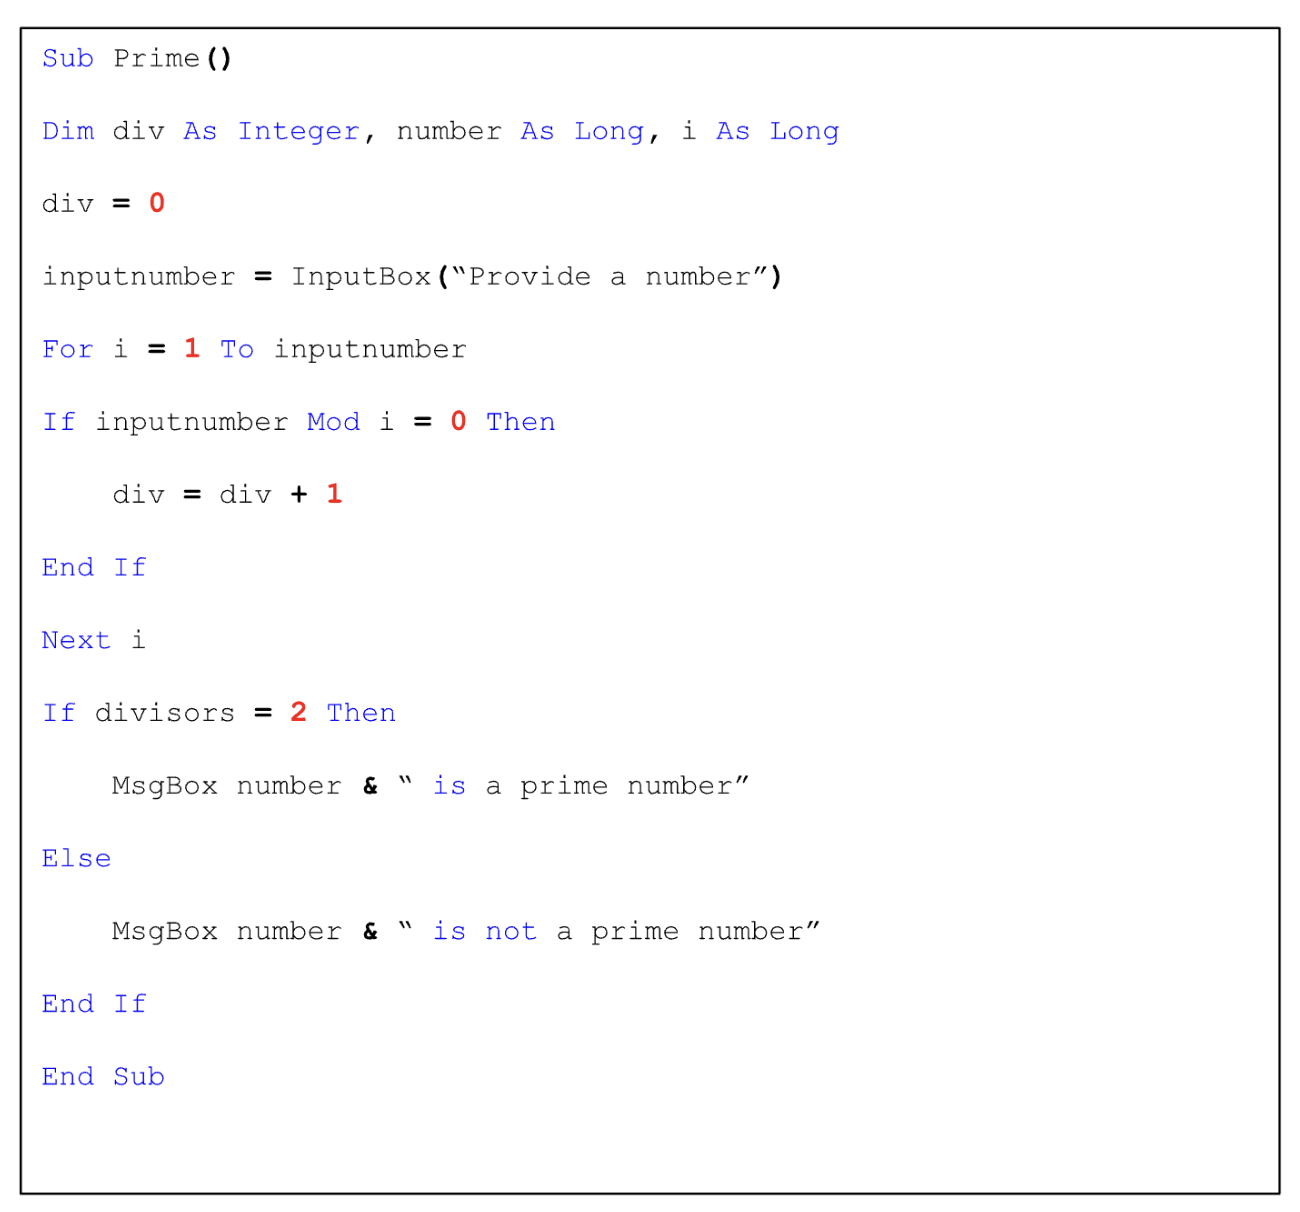
46. Calculate the area of a rectangle by writing a function in VBA
Ans. 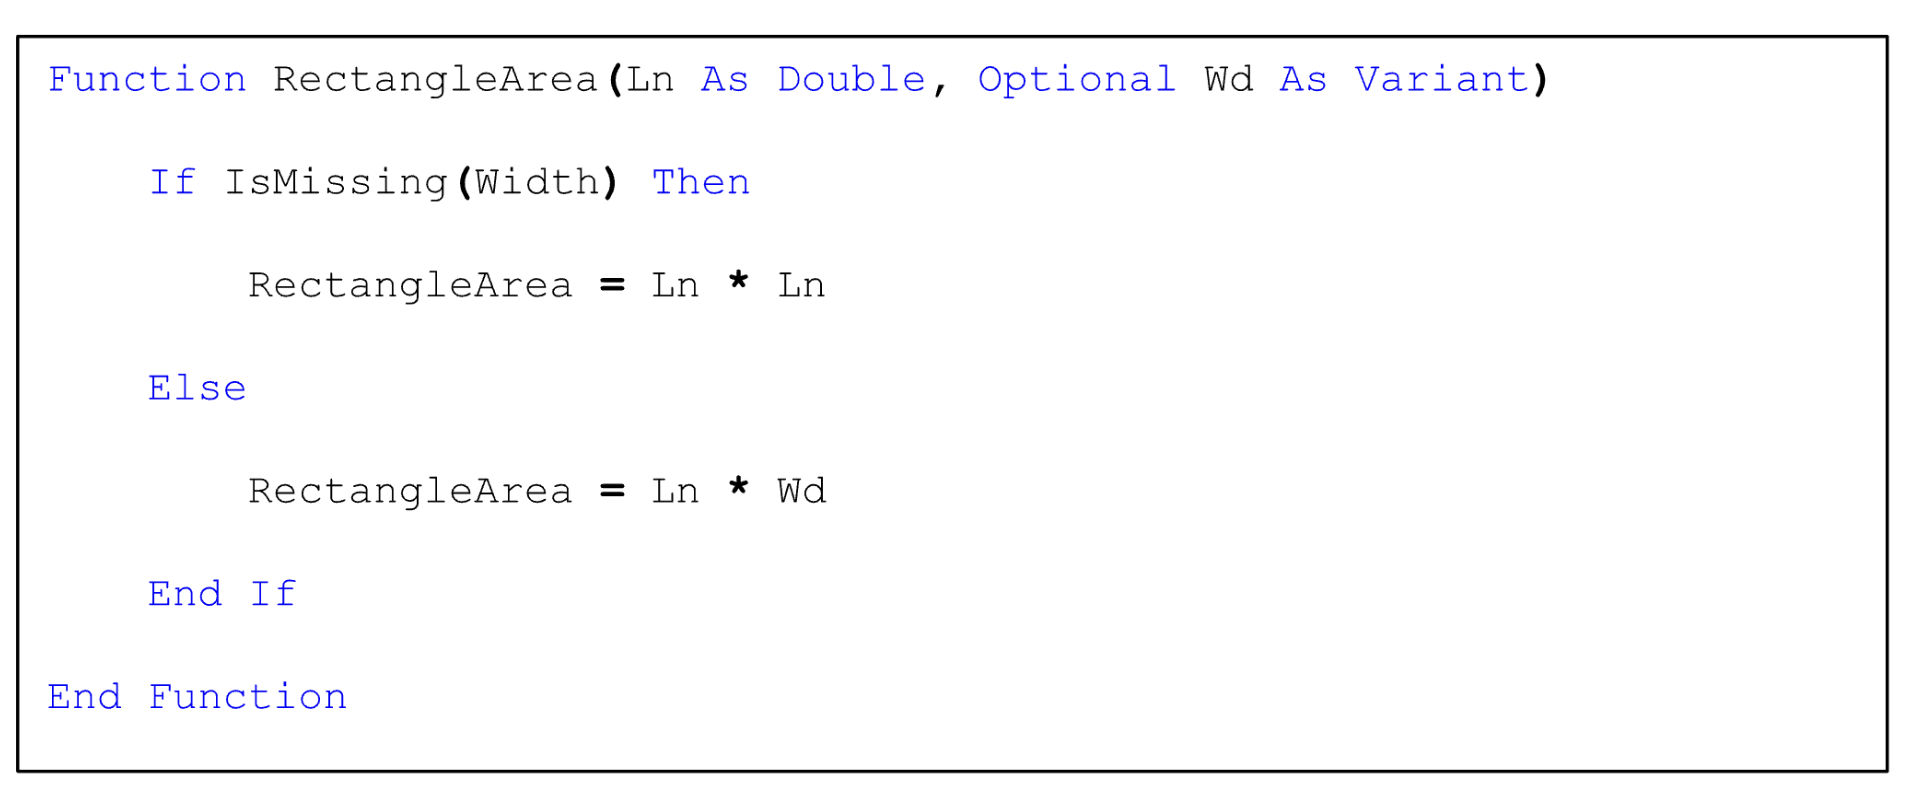
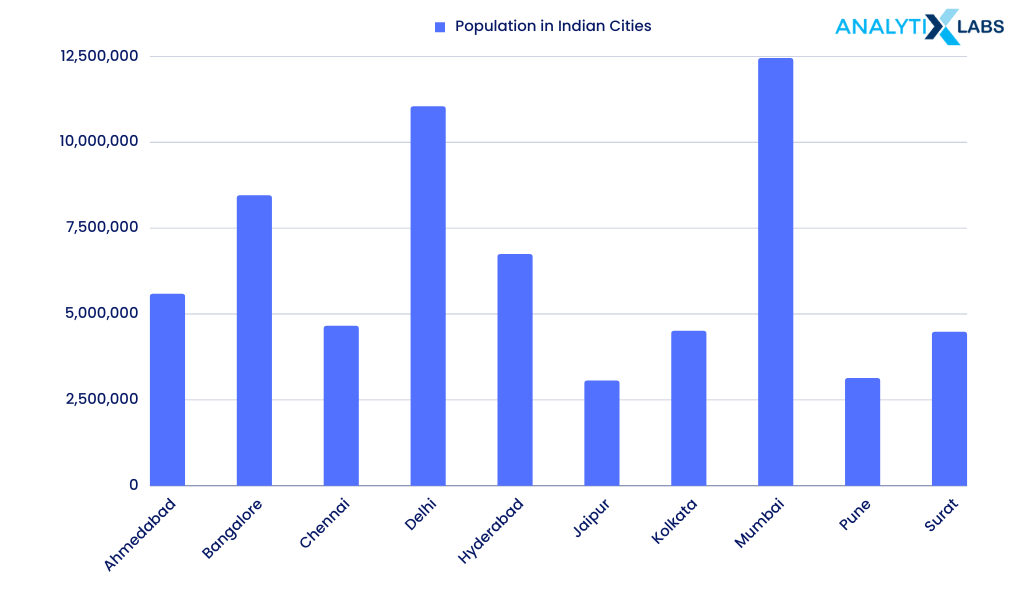
47. Create a bar chart using the data given below by writing a code in VBA.
| City | Population |
|---|---|
| Ahmedabad | 5,577,940 |
| Bangalore | 8,443,675 |
| Chennai | 4,646,732 |
| Delhi | 11,034,555 |
| Hyderabad | 6,731,790 |
| Jaipur | 3,046,163 |
| Kolkata | 4,496,694 |
| Mumbai | 12,442,373 |
| Pune | 3,124,458 |
| Surat | 4,467,797 |
Ans. 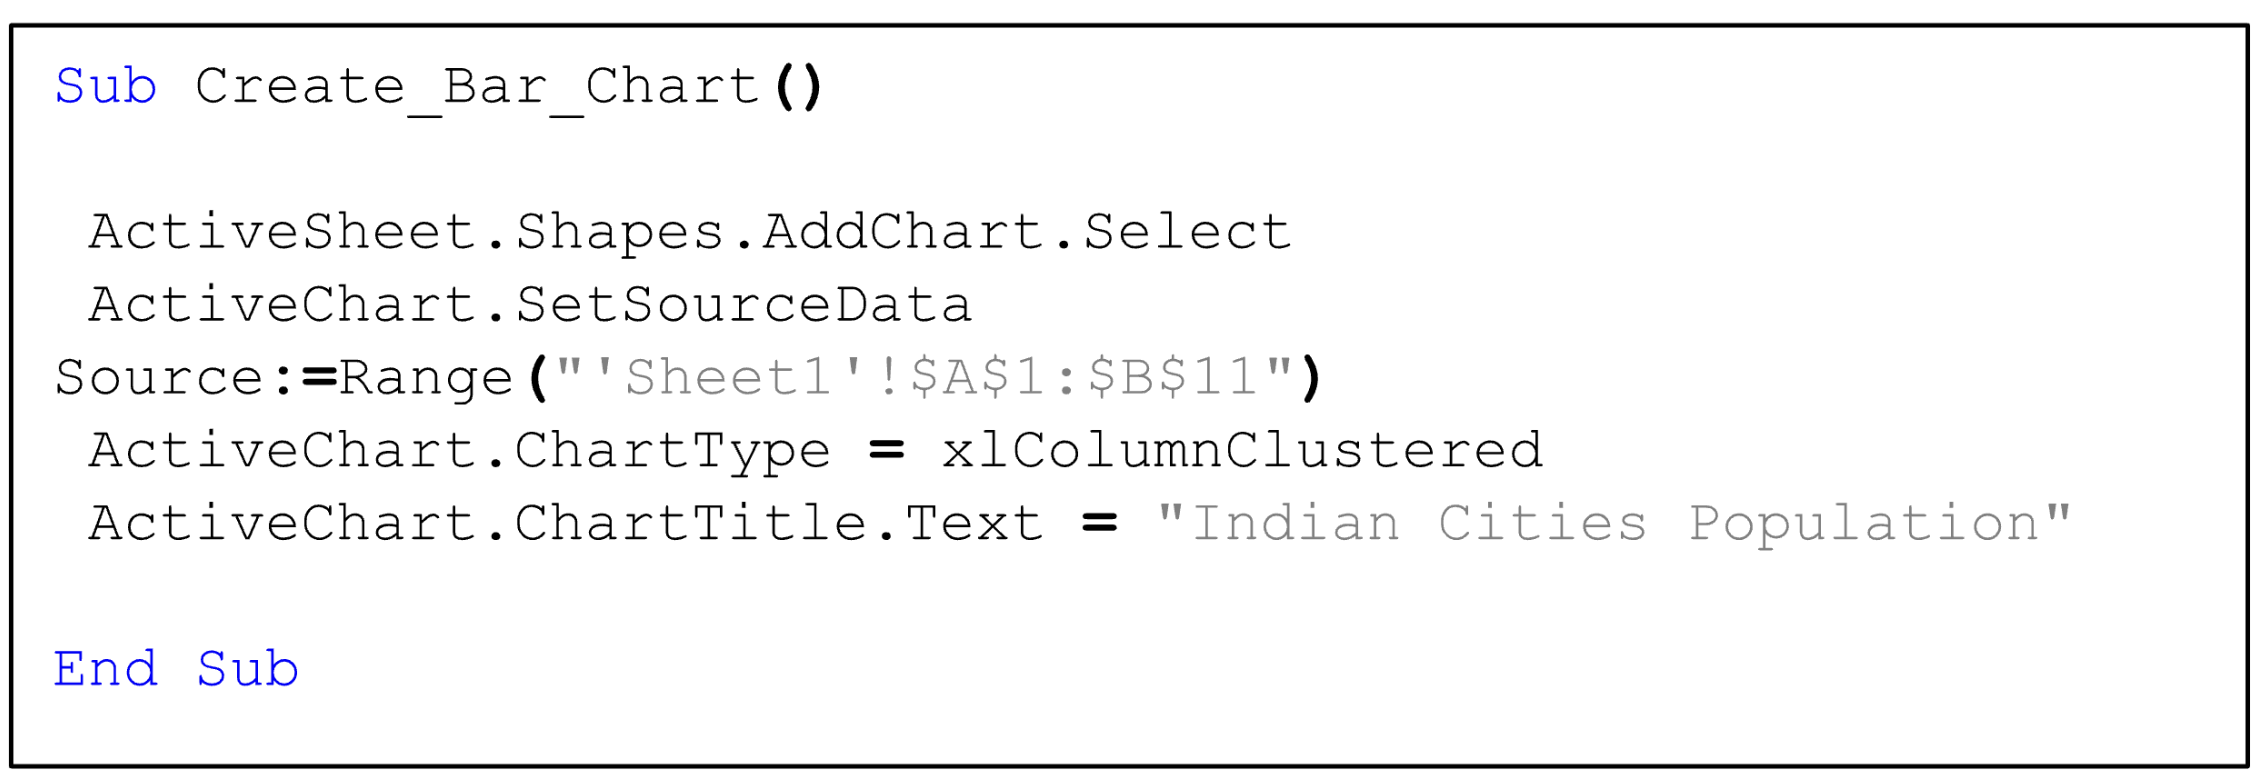
48. How to perform a Dependent t-Test?
Ans. You can use the function T.Test(), where you provide the following-
- array1 for sample 1
- array2 for sample 2
- select 1 or 2 for the one-tailed or two-tailed test
- select 1 for the dependent (paired) t-test
e.g. T.Test(A1:A10, B1:B10, 1, 1)
Also read: How to Perform Exploratory Data Analysis in Python?
49. How does a Slicer work in Excel?
Ans. In MS Excel, Slicer is used to filter Pivot tables quickly. It is possible to connect multiple slicers to multiple pivot tables.
To add a slicer to the pivot, perform the following steps-
- Step 1: Create a pivot table
- Step 2: Inside the pivot table, select any cell
- Step 3: Go to Analyze tab
- Step 4: In the Filter section, click on Insert Slicer
- Step 5: Select the column you want to use to filter the data
Once you follow these steps, a window will appear with the unique values of the above-selected column that you can then use to filter the pivot table.
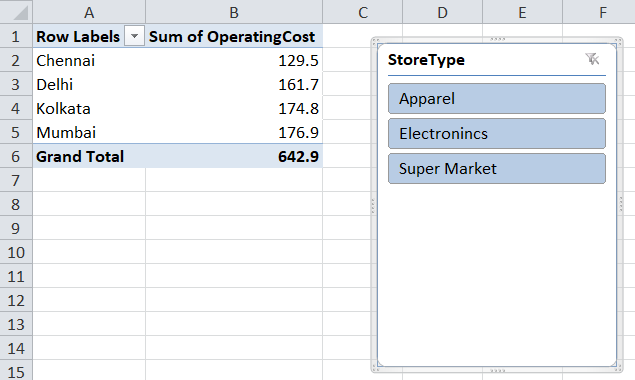
In the above example, if you select Apparel, you will find the sum of operating costs for those stores where the store type is ‘Apparel’.
50. What are the two ways of passing arguments to VBA functions?
Ans. One can pass the argument to VBA as value or as a reference. Let’s understand the difference with an example-
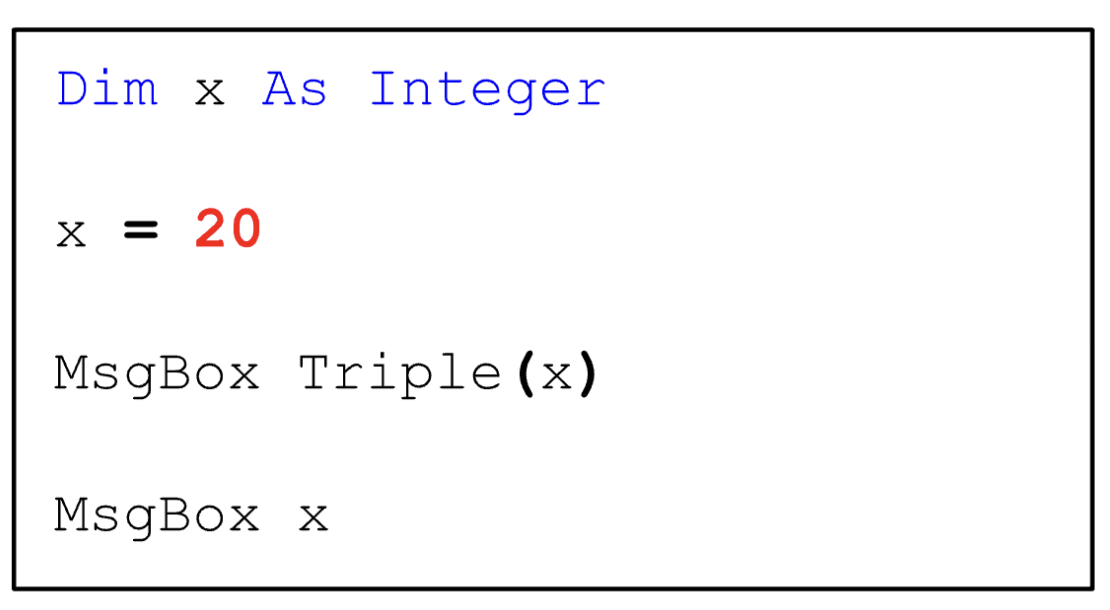
Now there are two ways of passing arguments-
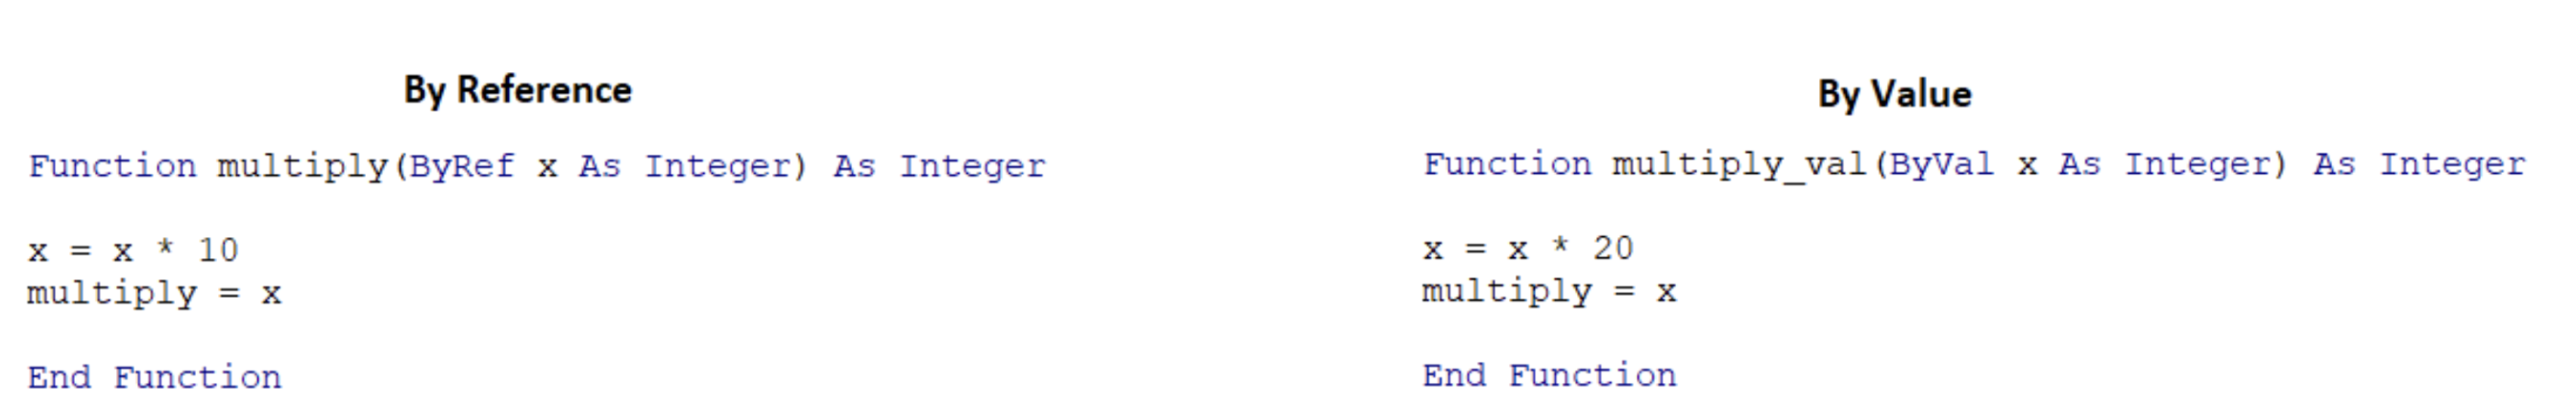
You will get 200 as the output both times if you run cells by passing the values as a reference. When arguments are passed by reference, you reference the original value, and the function changes the original value of x.
On the contrary, you pass a copy of the function when you pass the arguments by value, and the original value is unchanged. In the above example, the second box will display 20, as it was the original value.
While many possible Excel interview questions exist, these 50 are necessary. If you have gone through the above questions, your chances of cracking an Excel test for an interview would have increased. However, to leave no stone unturned, refer to the do’s and don’t when sitting for an Excel-based interview.
Other blogs in the Interview Question Series:
- Top 50 Data Science Interview Q/A
- Top 40 Data Analyst Interview Q/A
- Top 60 AI Interview Q/A
- Top 40 Deep Learning Interview Q/A
- Top 35 BA Interview Q/A
- Top 31 Data Engineering Interview Q/A
- Top Puzzle-Questions Asked in Business Analyst Interview
- Data Warehouse Interview Questions
- Top 50 Python Interview Questions
Interview Tips: Do’s and Dont’s
Things to do
General tips
- Research company you are interviewing for
- Prepare responses to plausible questions
- Engage in conversation with the interviewer
- Showcase your personality during the interview
- Highlight your achievements
Excel specific tips
- Plan spreadsheet and provide table headings
- Save the Excel constantly.
- Use cell references and named ranges
- Define the purpose of the spreadsheet and page by naming them appropriately
Things not to do
General tips
- Avoid Being Late.
- Avoid Dressing Inappropriately
- Avoid creating a generic CV
Excel specific tips
- Avoid leaving blank rows and columns
- Avoid using numbers as columns
- Avoid leaving cells containing formula unlocked
If you follow the above do’s and don’ts, your Excel interview will go smoothly, and hopefully, you will come out on top.
Conclusion
MS Excel is a crucial tool in data analytics and data science. Excel helps you perform peculiar data-related operations, but it also helps you to understand your goal, identify required insights or existing roadblocks, understand what post-analysis decisions are to be made, etc.
Using Excel becomes more practical and acceptable for storing and analyzing limited data.
I hope the Excel interview questions and answers explored in this article helped you prepare. If you want to learn more about it, don’t hesitate to get in touch with us.
Become a Pro Data Scientist
Want to become a Data Scientist? Start with our career-defining and meticulously designed Data Science 360 Certification course. You can move up the ladder with our equally strong PG in Data Science Course and PG in Data Analytics – designed to help you upskill fast and give your career the much-needed push. Still, have questions? Reach out to us or book a demo now.