Whoever said the human resource department only hires lives in a non-existent timeline.
Companies, big and small, are putting in efforts to engage and retain valuable employees. The notions of maintaining a good work culture and work-life balance are driving talent acquisition, HR, and employee branding teams. An employee-oriented approach is a must for organizations now and is incomplete without HR analytics.
As the world keeps reeling from the after-effects of the Covid-19 pandemic and inflation, reports predict the global HR analytics market will reach $6.3 billion by 2030. This indicates a 12% CAGR growth between 2022 and 2030 [from $2.5 billion to $6.3 billion].
Although companies of all sizes are realigning their business strategies to combat the upcoming economic downturn in form of layoffs, TA teams are preparing to hire for critical roles and retain the same. And Analytics is the way for it.
In this article, we shall look into what is HR analytics, what is the need for HR data and analytics, how is data analytics in human resources used by an organization, what kind of HR data is collected by the organization, and how HR analytics supports human resource management.
What is HR Analytics?
Human resource analytics (or HR Analytics) is the data-driven process of gathering and analyzing employee or human resource data or HR data.
HR Analytics aims to improve the decisions impacting HR functions and the organization’s workforce performance. This specific type of data analytics is useful to improve the HR performance level, employee retention, and attrition rates.
HR Analytics is also known as human capital analytics .
This HR people analytics applies statistical methodologies and techniques to provide understanding into “how investments in human capital assets contribute to:
- Generating revenue
- Minimizing expenses
- Mitigating risks, and
- Executing strategic plans
It involves analyzing employees’ behavior, interactions, performance, and productivity.
- What is the employee turnover rate or the attrition rate?
- How high or low is your employee turnover rate?
- What are the employee values and retention rate?
- How many employees deserve a promotion?
- Do you know which employees will leave the organization in the upcoming year?
- What percentage of employee turnover is regretted loss, regrettable, or unwanted turnover?
To answer these questions, HR analysts study and analyze various datasets.
This acquired data is useful for offering quantifiable metrics and insights such as the contributions made by the workforce, understanding each human resource process, and implying what works for an organization and what doesn’t.
These derived insights and patterns showcase the areas that need improvements and help an organization make strategies to plan for the future.
Types of Human Resource Analytics
There are various types of HR Analytics that a company considers while evaluating employees and, assessing its strengths, weaknesses, and ascertaining the correct right course of action.
Let’s look at the types of analytics for HR.
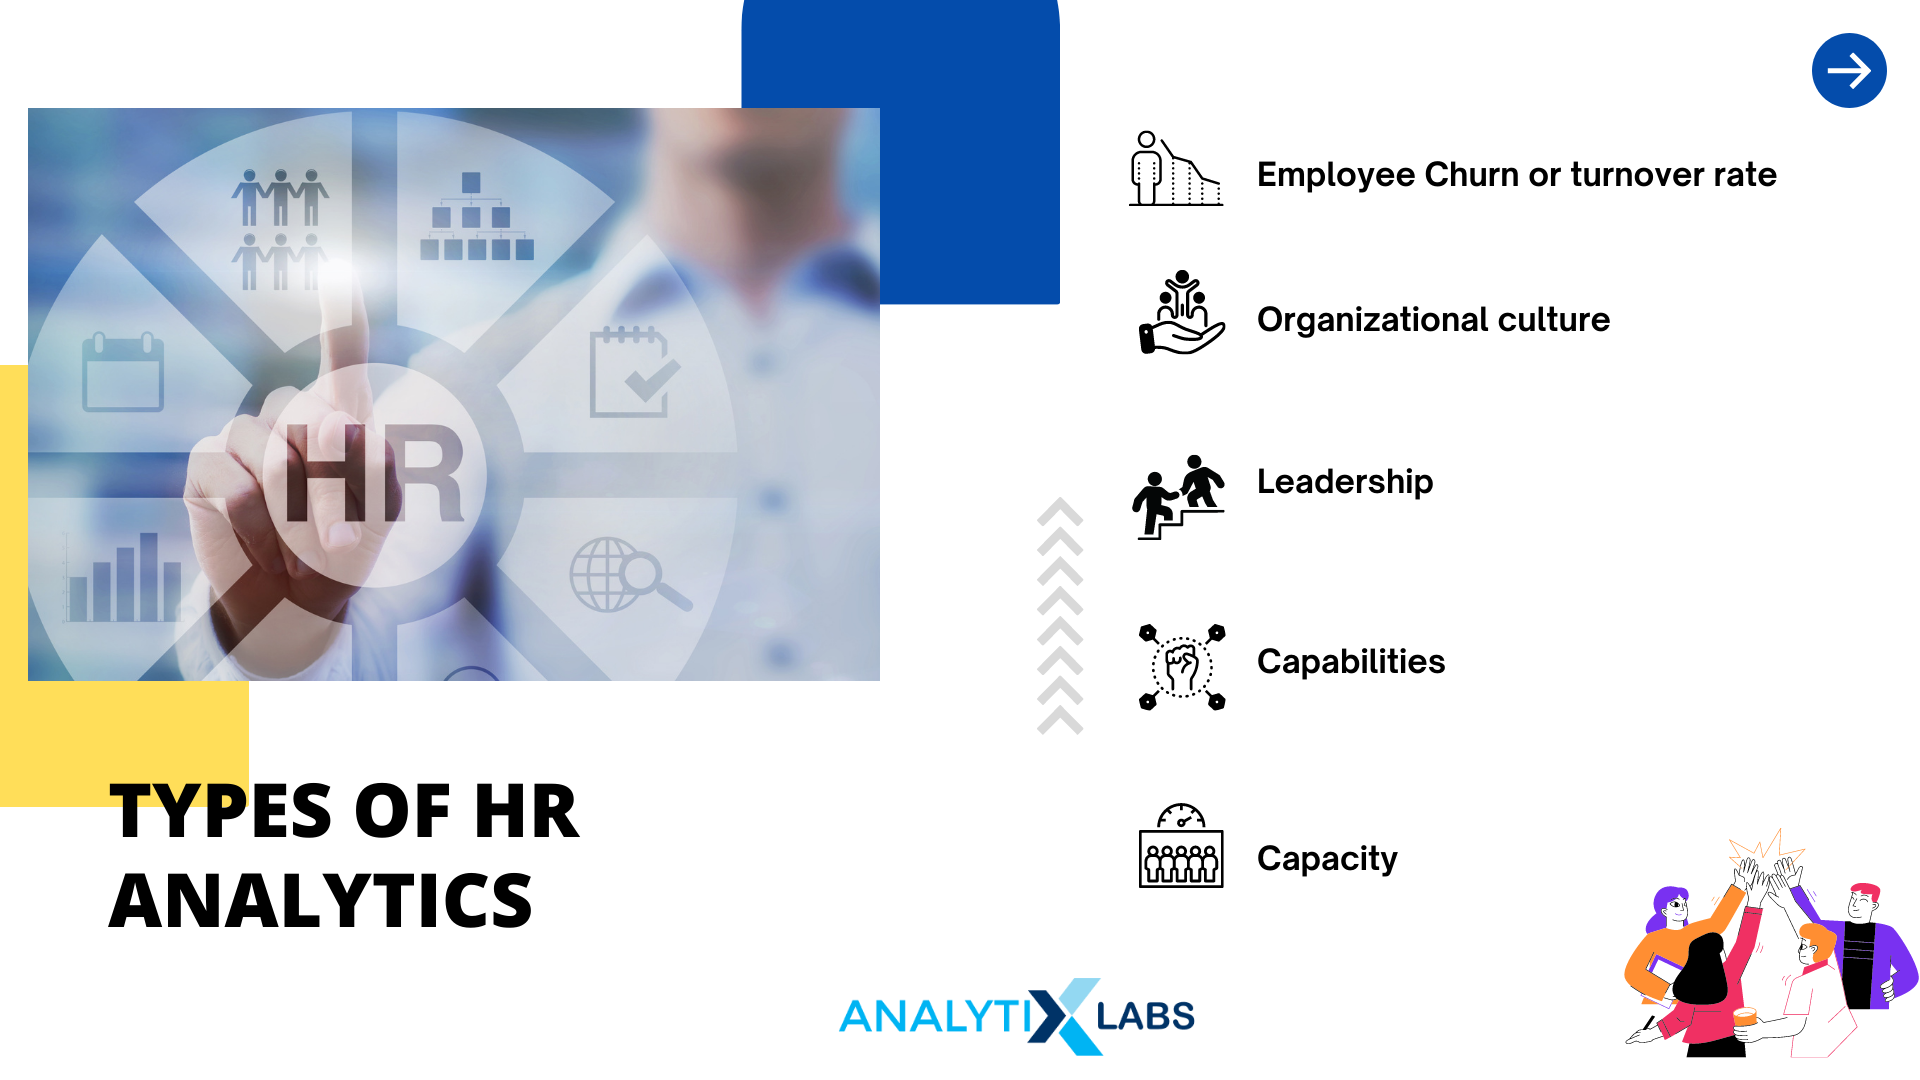
1. Employee Churn or turnover rate:
Employee churn or turnover rate reflects the total number of employees leaving the organization within a period. This analysis is useful for forecasting the future and decreasing employee churn.
Descriptive analytics show the past or historical employee churn, and predictive analysis predicts the future based on past data prescriptive analytics suggest the actions that can be taken to reduce it.
2. Organizational culture
Organizational or workplace culture is another key factor in HR analysis. This process understands and assesses the culture of the organization. It helps to tell how the organization operates daily. There are many benefits of improving the organization’s culture, such as decreased turnover rate, improved performance outcomes, and increased loyalty.
3. Leadership
It is imperative to analyze and evaluate the managers as well, along with assessing the employees.
Leadership shows the direction to the employees and reflects where the organization is directed, and henceforth, it is necessary to assess the managers.
Inefficient or poor leadership costs an organization in terms of monetary, time, and employee churn. It can also lead to higher turnover rates or attritions.
The HR data for conducting the leadership analysis can be acquired from qualitative and quantitative research such as employee interviews, surveys, polls, focus groups, and surveys to extract data to be reviewed or ethnographic research.
4. Capabilities
The ability of any business to do well or succeed depends on the employees’ skills and expertise. Capabilities assess and identify the strengths and core competencies of the employees. Once placed, the capabilities can be set as a yardstick to gauge and compare the personnel and measure any existing gaps.
5. Capacity
Capacity pertains to determining how efficient an organization’s employees or personnel are. Capacity is a key factor as it affects the revenue of an organization. Capacity also entails evaluating the behavior of the employees.
Behavioral analysis and capacity are useful in determining the employees’ contribution and capacity to grow.
For example, in the service industry, the revenue-generating factor is how satisfied the customer is, measured by how many customer queries are resolved. Instead of resolving customer queries, the employees invest excessive time in meetings and discussions.
Levels of HR Analytics Maturity
Before starting with analytics, it is important to understand your organization’s current level.
Forbes noted the top 10 human capital trends for 2023, in which the #1 is employee well-being. Infact, recent research by Paychex shows that most employees now decide to apply for a position based on the employee benefits directed toward employee well-being.
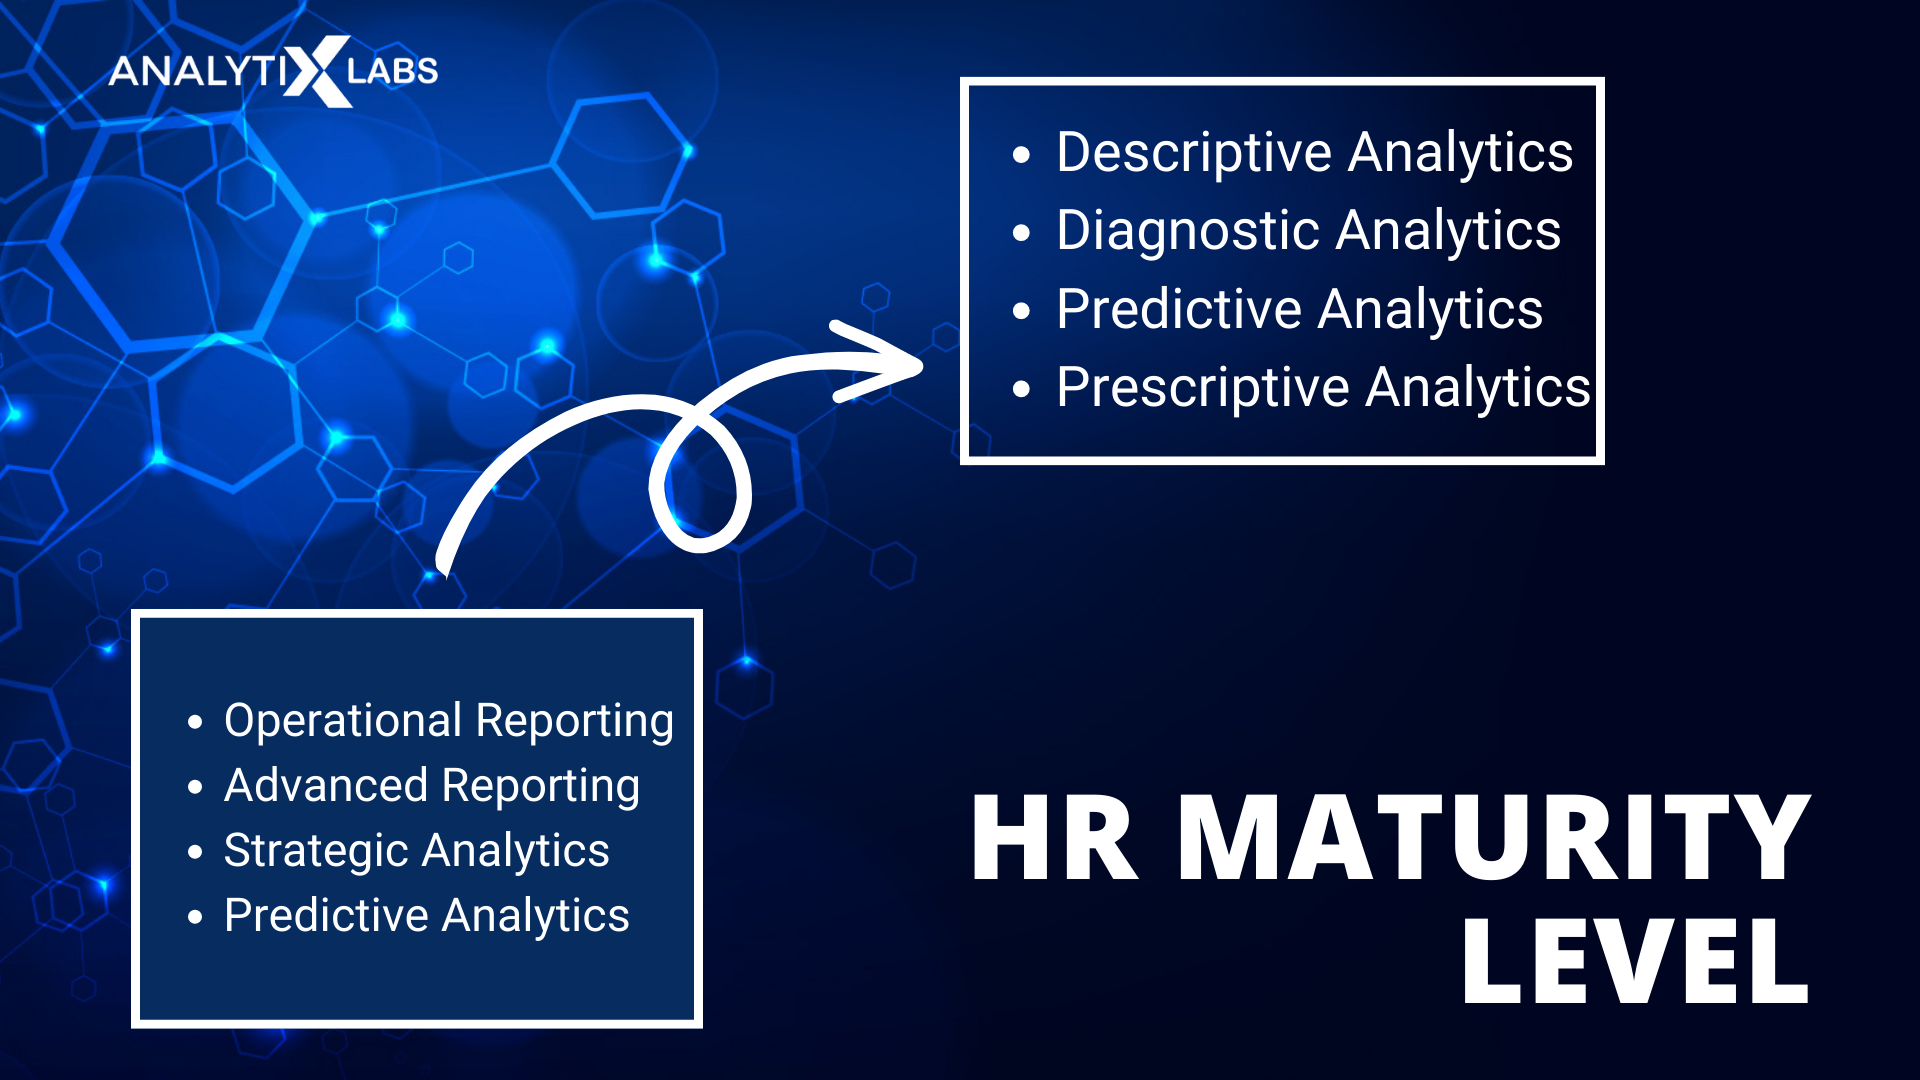
All of this depends on the HR maturity level of your organization. First initiated by Deloitte, the HR maturity model categorizes companies into four levels:
- Operational reporting
- Advanced reporting
- Strategic analytics
- Predictive analytics
In a more technical language, these stages are also termed:
- Descriptive analytics
- Diagnostic analytics
- Predictive analytics
- Prescriptive analytics
Also Read: Different Types of Analytics
1. Descriptive Analytics
Descriptive analytics is the first type of analytics that describes the current state of the data.
It helps describe the past event, i.e., what has already happened. It supports the analysis by providing the historical patterns in the HR data. The raw historical data is summarized into more understandable information.
For example:
- Metrics such as turnover rates, time-to-fill, and employee headcount are all types of descriptive analytics. Segregation by demographic or income levels is also categorized as descriptive analytics.
- To compute the employee turnover rate, we would need to know the past employee attrition data as it would indicate the reasons for the employee leaving the organization and help reduce the same.
2. Diagnostic Analytics
Diagnostic analytics are useful for exhibiting the underneath cause of the problems. Descriptive analytics shows if any problem exists in the data, and diagnostic analytics helps understand the causes of those problems.
For instance, the employee attrition rate is high, which indicates that employees are leaving. Still, you need to find out why. This is where diagnostic analytics helps to dissect the issue and identify the causes.
3. Predictive Analytics
Predictive analytics involves forecasting the future with the help of historical data patterns.
It employs statistical methods such as data mining, data modeling, and machine learning for predicting future risks and opportunities for a firm. Predictive analytics determine the probability of what will occur in the future based on the previous data.
For example, Predictive HR analytics is useful to:
- Find out which employees can leave the organization within the next quarter or year.
- Predict the success or failure of future projects.
- Determine if a prospect is suitable for the organization before they’re hired.
4. Prescriptive Analytics
Prescriptive Analytics is the last step on the ladder in the types of analytics. As the word ‘prescriptive’ says, it prescribes what must be done based on the predictions made. Prescriptive analytics depends on the other three types of analytics.
Prescriptive analytics offers suggestions or recommendations for the future that needs to be given the predictions and the past events or occurrences.
For instance, prescriptive analytics can recommend the course of action needed to decrease the company’s turnover or attrition rate.
This is answerable via executing the statistical models and forecasts. The models are created on the patterns discovered within the descriptive analytics. It also involves simulation processes of the prescribed actions to understand the consequences.
Descriptive analytics takes a backward look, whereas predictive and prescriptive analytics is about the future.
How it Supports the Human Resource Management
Human capital analytics has transformed traditional HR practices. The earlier practice of HR resources to recruit new talent, record, and maintain employee data has been outgrown.
In the age of analytics, it is not sufficient to limit Human Resource Management only to this when the data can speak volumes in itself and convey trends.
Data analytics in human resources allows the following:
- Empowers the HR leaders, individuals, and executives to make informed, data-driven, and strategic business decisions
- Build new business use cases that require HR involvement
- Test and validate the efficacy of these initiatives
- Present KPIs in a visual and graphical user interface-friendly manner
- Shift from operational taskmaster to tactical and strategic resource
How To Start With HR Analytics?
Steps to have HR analytics and reporting in place for an organization:
Describe objectives
As the saying goes: By failing to plan, you are planning to fail.
The first and foremost step to getting started with HR data analytics is to have a blueprint or plan of action in place.
It is paramount to know and incorporate what the stakeholders require. The organization’s goals can be to reduce costs, increase revenue, achieve optimal profit margin, or recruit additional resources.
Having this bird-eyes view will help one to know what HR analysis to conduct, ask the relevant questions and break each aspect on a granular level, or a consolidated solution can be implemented addressing all the requirements.
- Employee turnover
- Employee Engagement
- Sales efficiency
- Compensation
- Talent management and analysis of recruitment
- Customer retention and risk
- Performance management
- Product and Service Quality
An important step in implementing analytics in HR is breaking the problem or requirement into smaller steps.
Segregating, prioritizing the issues based on criticality, and starting small yields bigger, more sustainable solutions.
A comprehensive analysis of the HR functions, setting standards or benchmarks, and making the necessary adjustments to align with the long-term business objective is the key.
Efficient Workforce
The role of HR is not only limited to acquiring the right talent for an organization or maintaining its records. It also drives insights into the capabilities of the current personnel and their performance, forecasting future requirements, and analyzing and minimizing any gaps.
Gaps may exist between the present skills and future required skills. This all requires predictive analytics, which can be used to improve employee performance and productivity. Hence, HR personnel must also upgrade themselves with artificial intelligence and new technologies to predict trends.
HR professionals must learn about data analytics in human resources and how it greatly impacts an organization’s strategic decisions. This view helps them get perspective and take the necessary steps to improve and contribute.
The HR leaders play another important role as they can organize technical and professional enhancement training to smoothly transition into the advanced digital transformation and leverage these opportunities.
Enhancement of Technology and Use of Data Science
Data Science is necessary for human resource analytics.
These quantifiable metrics and getting data-driven insights are dependent on statistical analysis and data mining, and data science is the backbone for this.
Tools such as SQL, and Hadoop, knowledge of programming languages such as Python, and segments of artificial intelligence such as deep learning, machine learning, and natural language processing power the big data interfaces.
The skills and expertise with these are needed to analyze, discover the patterns, and drive impactful business-oriented conclusions.
Additionally, to present the findings, investing in visualization tools is necessary. Tools such as PowerBI and Tableau are useful in presenting the results and trends in the form of stories and dashboards to the end-users and stakeholders.
With such a need, it is ideal to have data scientists in the team as generalist HR may not be equipped with the required skills.
Learning Resource: Enrol for the PG in Data Science Course to enhance your data science career.
Apart from conducting the analysis, employing statistical methodologies, and ensuring the validity of the data, and accuracy of the models, the data scientist is also skilled to acquire the data from various sources, clean it, and organize the dispersed data.
Cloud-based and Subscription Model
Maintaining on-premise hardware and solutions is heavily expensive and also has the risk of losing data.
Preserving the data HR on the cloud reduces IT costs as it saves storage and hardware costs, can scale the business, the data is easily replicable, maintains business continuity, and minimizes downtime. This enables HR data and analytics to employ solutions as per their requirements.
Additionally, subscribing to Software as a Service (SaaS) is beneficial for data analytics in human resources as it is more cost efficient since it can easily upgrade to the latest technology and need not require to invest in a separate analytics solution.
Comply with Legal Norms
HR managers and their team must ensure to comply with the legal decree and laws to preserve the ethics and compliance terms. The legislation governs the type and form of data acquired by analytics in HR. HR must maintain transparency and integrity for the following key aspects:
- Maintain employee confidentiality
- Procure written from the personnel for the type and amount of data collected by the organization.
- Proper IT security policies must be documented and signed with the necessary officials while applying the third-party software for employing the HR data and analytics.
- The HR analytics and reporting vendor details along with their location must be stored and documented in line with the local laws.
What Data Does an HR Analytics Tool Need?
Analytics in HR is incomplete without gathering the appropriate and quality data. The HR people analytics data largely comprises internal and external data sources. These data sources are further classified as follows:
-
Internal Data
The internal data primarily consists of the data obtained from the HR department of a company. These are collected from varied sources such as Customer relationship management (CRM) databases, surveys, attendance records, documents including recruitment database, and employee details forms.
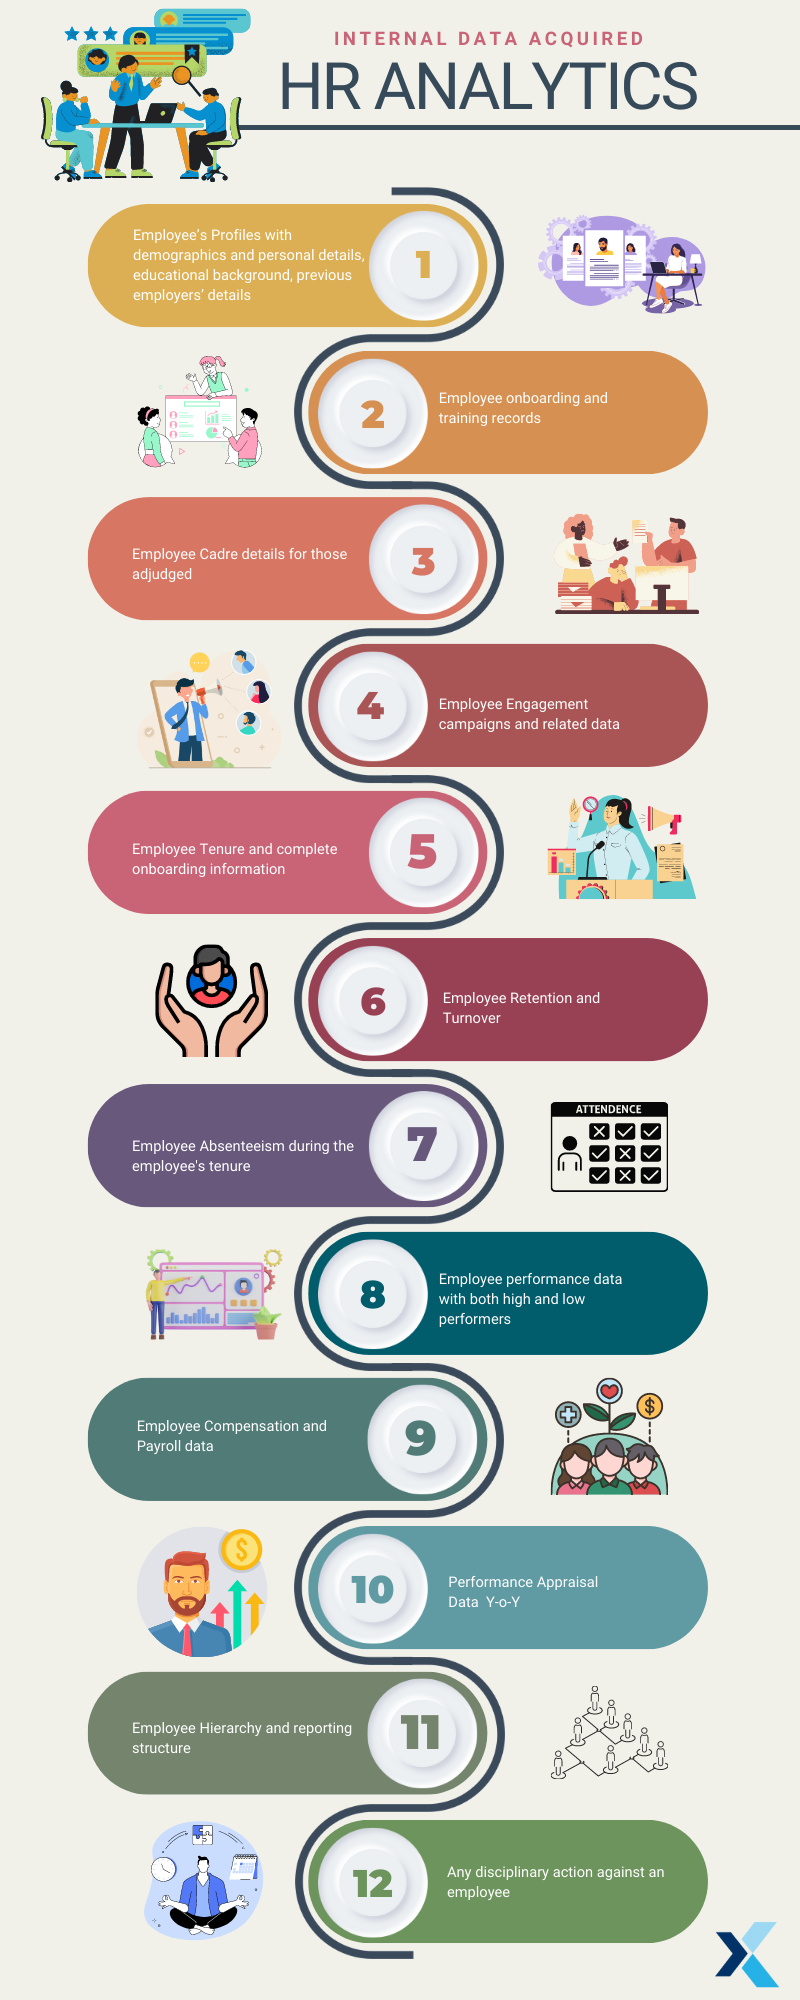
The HR data acquired includes –
-
External Data
The external data is required to have a bird-eyes view of the employee and is acquired by maintaining relationships with the other departments of a company.
The external data sources include but are not limited to the following:
- Financial data: Company-level financial data is required for estimating the cost of hiring, revenue per employee, or the cost to a company
- Implicit or Passive data such as acquiring information about the employee from LinkedIn and social media network posts and feeds
- Labor Market and Population data
- Economic trends
- Job-market research data
It is not only important to gather and track high-quality data but also to handle and process this data. Processing the data is as crucial as collecting the data as it is of no use to collect data if can not drive data-backed findings to fulfill the business need.
Henceforth, the need for skilled hands-on technical manpower is essential with the advanced data analytics in human resources tools and software assisting with data processing and cleaning.
Use Cases and Examples of HR Analytics
HR people analytics is applied by stalwarts namely by employing the human resources practices in the following manner.
Google is heavy on employee engagement and Wal-Mart focuses on capability metrics, employee turnover, and movement.
- Microsoft
Microsoft created the statistical profiles of its employees who were likely to leave the organization enabling it to decrease its turnover rates by more than half in each case. In recent research, Microsoft invested in understanding and analyzing its remote workforce.
- Juniper Networks
Juniper Networks not only uses LinkedIn to recruit but also tracks where its top-performing employees have joined post exiting the organization with the purpose of gaining perception into various industry career paths.
- Royal Dutch Shell
Royal Dutch Shell measured the human potential of who generates the best idea by asking its approx 1400 employees to play video games. These games were curated by psychologists, neuroscientists, and data scientists.
More use cases on how companies are using HR Analytics to reduce employee attrition rates
What Metrics Does HR Analytics Measure?
Primarily, the analytics in HR analytics involve the following common metrics:
1. Time to fill
Time to fill represents the number of days that the job description was shared and the days it took to fill the position. Measuring this enables HR to evaluate and budget the time spent.
2. Time to hire
Time to hire reflects the number of days between approaching a prospective resource and the prospect accepting the job offer.
3. Hiring costs
Hiring cost is the total expenses in recruiting and hiring resources.
4. Revenue per employee
Revenue per employee represents the average revenue generated by each employee and implies the efficiency of the organization in generating revenue from its employees. This is estimated by dividing the revenue of the organization by the total number of employees in the organization.
5. Offer acceptance rate
Offer acceptance rate is computed by dividing the total number of formal and written job offers by the total number of job offers given in a period. A ratio of 0.85 is considered good and below 0.85 calls for investigation and the need for improvement.
6. Training expense per employee or Training efficiency
Training efficiency is measured by calculating the training per employee i.e., the total training expense is divided by the total number of employees who had received training.
Additionally, the effectiveness of training is measured by weighing the performance improvement, test scores if any, and asking for reverse knowledge transfer post-training.
Employee training efficiency has a direct impact on employee efficiency as it enables employees to be skilled for their jobs.
7. Absenteeism rate
Absenteeism is a productivity or employee efficiency metric calculated by dividing the number of absent days by the total number of scheduled business days.
Absenteeism conveys the average number of leaves and the frequency of leaves taken by an employee. It is important to measure the overall health of the employee.
8. Human capital risk
Human resources also come in handy with risks such as
- Absence of the required skilled resources to fill the position
- Unavailability of qualified leadership personnel for recruitment
- Possibility of resource attriting based upon parameters namely compensation
- Poor relationship with managers or subordinates.
Taking these into account is necessary for HR analysis.
9. Voluntary turnover rate
Voluntary turnover is when the employees themselves leave the organization so is computed by dividing the number of employees who voluntarily left the organization by the total number of employees in the organization.
10. Involuntary turnover rate
Involuntary turnover when the employee is terminated from the organization. The rate is estimated by dividing the number of employees who involuntarily left the organization by the total number of employees in the organization.
Endnotes
HR analytics is a niche area of data analytics with a focus on collecting and analyzing HR data to improve employee performance and drive data-backed insights helping an organization meet its long-term goals.
HR analytics also helps in employee engagement, creating efficient personnel, identifying needs for new functions, management of expenses, forecasting future requirements, and initiatives that require human resource involvement.
FAQs
What are the 4 levels of HR analytics?
Ans. The 4 levels of HR Analytics are:
- Descriptive Analytics
- Diagnostic Analytics
- Predictive Analytics
- Prescriptive Analytics
What is an HR analytics example?
Ans. Examples of HR analytics include:
- Turnover
- Absenteeism
- Hiring costs
Why do we need HR analytics?
Ans. The need for HR analytics exists because it provides answers to questions such as below:
- What is the employee attrition rate?
- What is the cause of the attrition, how to reduce it, and what are the findings that can be concluded from the attrition rate?
- How many employees leave the organization by themselves and how many are asked to leave?
- How much time does it take to hire and fill the resources?
- Which employees are frequently taking leaves or are absent from work?
- How much buffer is taken for the human capital risk?
- Which employees are likely to leave within the next quarter or year?

