Marketing analytics, in simpler terms, is to use analytics effectively and link marketing activities directly to business outcomes and long-term growth. Easier said than done, most businesses miss out on the crucial nuances of marketing analytics. Before jumping the gun, let’s understand if marketing analytics can really drive business growth.
Take any brand for example – Amazon, Nykaa, Netflix, Nike, Spotify – irrespective of the genre, these brands are growing and thriving on marketing analytics. If you strip away the product, the industry, and the geography, what remains is a relentless, disciplined investment in marketing analytics. These are not companies in the same business. One sells shampoo, another streams films, and another ships groceries overnight. And yet, what unites them at the core of their growth is identical: the ability to collect, interpret, and act on data faster and more precisely than their competitors.
Marketing analytics is no longer a back-office function reserved for data scientists. It has become the operating system of modern brand building. The brands that dominate today did not simply outspend their rivals; they out-learned them.
They built feedback loops that turned every customer interaction into a signal, every signal into an insight, and every insight into a sharper next move.
What is Marketing Analytics?
In layman’s language – marketing analytics helps businesses understand what is working, what is not, and why.
Marketing analytics uses data, statistical techniques, and analytical models to understand how marketing efforts impact business outcomes. It helps evaluate performance across campaigns, channels, and customer touchpoints. The insights guide decision-making and suggest ways to improve efforts over time.
For example, Amazon knows, before you do, what you are likely to buy next. Its collaborative filtering models do not just observe past behaviour. They shape future behaviour by surfacing the right product at the right moment. Every search query, every abandoned cart, and every product review is fed back into a predictive engine that makes the next recommendation more accurate than the last.
The result: ~35% of all Amazon revenue flows directly from algorithmic recommendation, without a single paid advertisement.
That is marketing analytics – treating customer data not as a by-product of doing business, but as the product itself. The data you gather informs the next campaign, the next product, the next conversation with a customer. This creates a compounding advantage that grows more powerful over time.
Why Is Marketing Analytics Important?
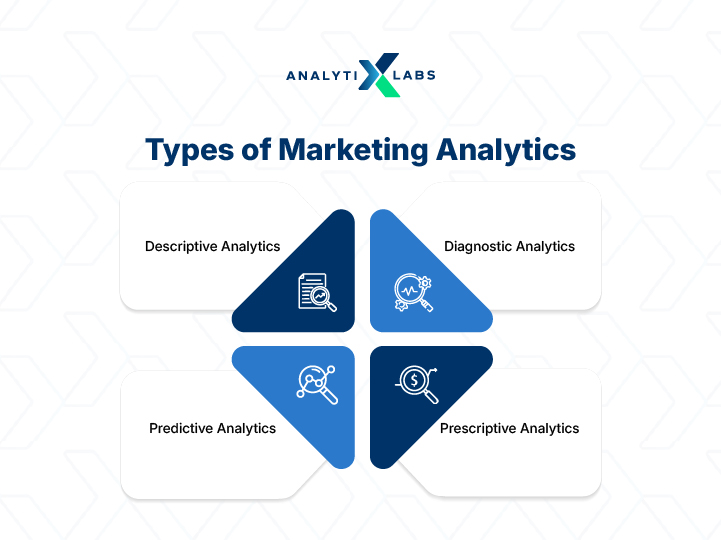
Marketing analytics typically operates across four analytical layers:
- Descriptive analytics explains what has happened by understanding historical performance.
- Diagnostic analytics uncovers why it happened by identifying performance drivers.
- Predictive analytics shows what may happen next by analyzing past data.
- Prescriptive analytics recommends what actions to take.
These layers help marketing teams move from basic reporting to proactive optimization and planning. In practice, marketing analytics is powered by specialized tools and platforms. Platforms like Google Analytics 4 (GA4) enable event-based analysis across web and mobile, while Think with Google provides frameworks for measuring marketing effectiveness. CRM-linked systems provide insights into lead quality and conversion paths. These insights are visualized through real-time dashboards tracking metrics.
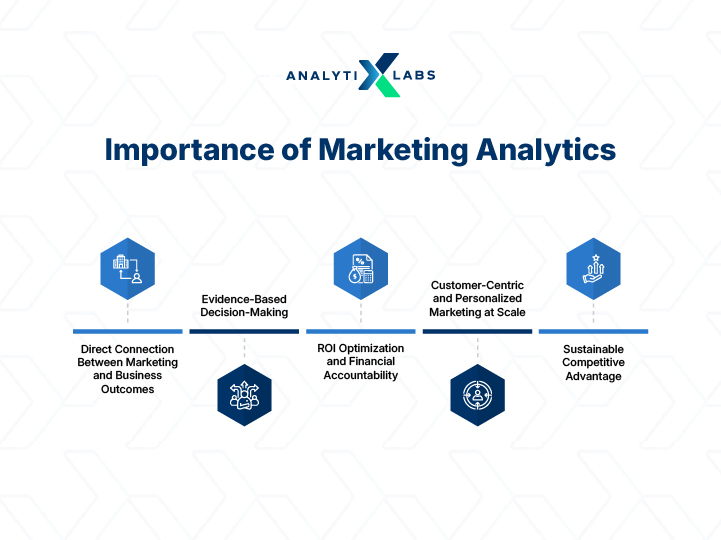
The importance of marketing analytics can be understood across the following key areas:
-
Direct Connection Between Marketing and Business Outcome
Marketing analytics enables organizations to evaluate business outcomes such as revenue growth, customer acquisition efficiency, retention, and lifetime value of daily marketing activities. Industry research, including Salesforce’s State of Marketing reports, consistently shows that high-performing marketing teams rely far more on analytics, automation, and integrated data systems than those that struggle to scale.
When marketing and business outcomes are directly connected through data, every campaign decision carries financial weight. Teams stop operating on instinct and start operating on evidence — and the difference in performance is measurable.
| BRAND EXAMPLE — AMAZON Amazon’s marketing analytics directly links advertising investment to revenue outcomes through its Amazon Marketing Cloud (AMC) — a clean-room environment where advertisers run SQL queries across impression, click, and purchase data. Sponsored Products campaigns are evaluated not on click-through rates alone, but on attributed revenue and Return on Ad Spend (ROAS), which typically ranges between 4× and 6× for well-optimized campaigns. Amazon’s internal teams track the contribution of recommendation-driven revenue (approximately 35% of total GMV) as a direct marketing outcome, making the case for continued investment in personalisation infrastructure at board level. This is marketing accountability in its most mature form:every dollar of spend traced to a dollar of outcome. |
|---|
-
Evidence-Based Decision-Making
Marketing analytics allows marketing teams to eliminate guesswork about which campaigns or channels perform best. Marketers can attribute conversions and revenue to specific actions using structured data models.
This visibility helps organizations detect underperforming initiatives early, run controlled experiments, optimize campaigns in near real time, and redirect budgets toward high-impact efforts.
For professionals working with data, marketing investments become more predictable, measurable, and defensible.
BRAND EXAMPLE — NETFLIX Netflix is the canonical example of evidence-based marketing at scale. Rather than relying on creative instinct or audience assumptions, Netflix runs more than 250 A/B tests simultaneously — testing thumbnail artwork, preview clips, email subject lines, notification timing, and autoplay behaviour. Each test has a defined hypothesis, a control group, and a success metric tied to long-term retention rather than superficial engagement. When a new title launches, different cohorts see entirely different visual presentations of the same content — a thriller fan and a romance fan may see completely different cover images — because the data shows this increases watch probability. No creative asset is assumed to be optimal. Every assumption is tested. This culture of structured experimentation has made Netflix’s marketing function one of the most defensible in media.
-
ROI Optimization and Financial Accountability
As marketing budgets increasingly face CFO-level scrutiny, analytics provides CMOs with a transparent framework for justifying spend and forecasting returns.
Advanced analytics practices, such as cohort analysis, attribution modeling, and incremental lift measurement, enable businesses to quantify the impact of marketing on revenue, profitability, and customer lifetime value.
Insights from Deloitte’s marketing analytics research highlight that organizations with mature analytics capabilities are significantly better at linking marketing performance to financial outcomes, positioning marketing as a strategic growth function rather than a cost center.
BRAND EXAMPLE — BARCLAYS
In financial services, where marketing spend faces intense internal scrutiny and regulatory oversight, Barclays has built one of the most financially accountable marketing analytics stacks in the industry. Their Next Best Action (NBA) engine — built on SAS and Azure ML — analyses over 500 variables per customer to determine the optimal product offer, timing, and channel for each individual.
The ROI case for this investment is not theoretical: campaigns triggered by life-event signals (such as a salary increase or a new direct debit detected in transaction data) deliver a 31% conversion uplift versus control groups receiving generic communications.
Barclays has used this data to shift marketing from a cost centre framing to a revenue attribution model, presenting CMO-level reports that directly link campaign investment to mortgage applications initiated, ISAs opened, and credit products activated.
-
Customer-Centric and Personalized Marketing at Scale
By analyzing behavioral signals, engagement patterns, and transactional data, businesses can move beyond broad demographics to build dynamic, intent-based customer segments. These insights power personalization across channels, from content recommendations to timing and messaging that result in higher engagement and conversion rates. Industry data from HubSpot consistently shows that analytics-driven personalization outperforms generic campaigns in the highly competitive digital environment.
BRAND EXAMPLE — NYKAA Nykaa’s approach to personalization at scale is a masterclass in applying behavioural analytics to a market as diverse and nuanced as Indian beauty retail. Rather than segmenting its 80 million+ users by age or gender, Nykaa’s cohort engine classifies customers by skin type, brand affinity, purchase recency, price band sensitivity, and even seasonal purchasing patterns tied to regional festivals. This powers a home screen that adapts to each user, a notification strategy that fires at the individual’s optimal browsing window, and a cart abandonment flow that delivers targeted interventions at 20-minute, 2-hour, and 24-hour intervals — recovering approximately 9% of carts that would otherwise be permanently lost. The Shade Finder tool on the app generates structured first-party data about complexion and skin undertone, feeding product recommendations that achieve 3× higher click-through rates than generic listings. This is what it looks like when personalization is engineered rather than approximated.
-
Sustainable Competitive Advantage
Marketing analytics creates a sustainable competitive advantage. Organizations that can rapidly interpret data, test hypotheses, and refine strategies based on real-time feedback adapt faster to market shifts and evolving customer expectations. In a business landscape defined by automation, experimentation, and personalization, marketing analytics is not optional but a foundational capability for long-term business success.
BRAND EXAMPLE — NIKE & SPOTIFY
Two brands from entirely different industries illustrate what sustainable competitive advantage looks like when built on analytics. Nike’s pivot from wholesale to direct-to-consumer was not a branding decision — it was a data decision.
Nike built a 155-million-strong NikePlus membership base. It gained first-party behavioural data (workout frequency, gear usage, training goals) that no wholesale partner could provide. Members generate 3.4× the lifetime value of non-members, and Nike’s paid media allocation is now calibrated to that differential with precision.
Competitors cannot replicate this advantage overnight because it took a decade of data accumulation to build.
Spotify’s advantage operates similarly. Its Wrapped campaign — which transforms each user’s listening data into a shareable annual story — generated over 60 million organic social posts in 2023 at near-zero media cost. No paid campaign could buy that reach.
Both brands have built advantages that are structurally difficult to replicate, because they are grounded in proprietary data accumulated over years of customer interaction.
Across all five areas, a single pattern emerges: the brands that grow consistently are those that have made analytics inseparable from strategy. They do not use data to report on what happened last quarter. They use data to decide what happens next week.
Pro tip:
Collect the signal. Interpret it faster than the competition. Act on it with precision. Measure the result. Repeat . And that, across every industry and every geography, is what separates the brands that scale from the brands that stall.
Characteristics of Marketing Analytics
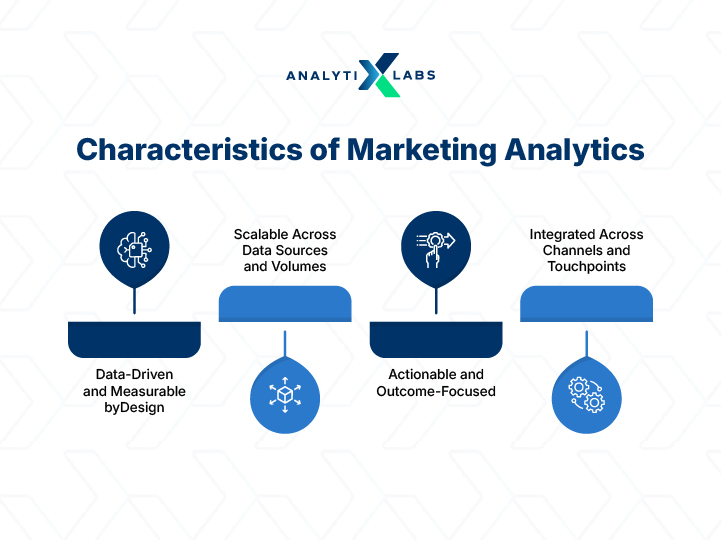
Effective marketing analytics is defined by several core characteristics that distinguish it from basic reporting or ad-hoc data collection. Understanding these characteristics helps organizations build analytics capabilities that deliver consistent, reliable, and actionable insights.
The key characteristics of marketing analytics are:
-
Data-Driven and Measurable by Design
Marketing analytics is grounded in quantifiable data, not assumptions or intuition. Every conclusion, recommendation, or strategic decision must be backed by quantifiable data rather than assumptions. IBM’s analytics framework emphasizes that measurability enables organizations to track progress, compare outcomes, and continuously refine marketing strategies based on evidence.
-
Scalable Across Data Sources and Volumes
Modern marketing analytics systems must handle large volumes of high-velocity data from multiple sources. Real-time analytics enables marketers to respond immediately to campaign performance, customer behavior shifts, and emerging opportunities.
-
Actionable and Outcome-Focused
Descriptive statistics alone are insufficient to drive decisions. Instead of stopping at “what happened,” it addresses questions such as what should we do next, which lever will improve ROI, and where should budgets be reallocated. This outcome-focused approach turns analytics into a decision-support system rather than a passive reporting function.
-
Integrated Across Channels and Touchpoints
Customer journeys span email, social media, search, display advertising, and offline touchpoints. Analytics that operate in silos miss critical connections between channels, leading to incomplete attribution and suboptimal budget allocation. Effective marketing analytics integrates data across channels to create a unified view of performance.
Types of Marketing Analytics
Marketing analytics can be classified into four distinct types based on the kind of questions they answer and the level of insight they provide. Together, these types of marketing analytics help organizations move from understanding past performance to making data-backed decisions about future actions.
To build a decision-driven marketing function, organizations and analytics professionals must master the following types of marketing analytics:
1) Descriptive Analytics
Descriptive analytics focuses on summarizing historical marketing data to understand what has happened over a specific period. It answers the most basic but essential question, “What happened?”
Key characteristics
- Tracks metrics such as website traffic, impressions, click-through rates, conversions, and revenue.
- Presents data through dashboards, reports, and visualizations.
- Commonly used for campaign reporting, performance reviews, and stakeholder updates.
According to Tableau’s explanation of descriptive analytics, this type of analytics transforms raw data into clear summaries that establish a factual baseline. While it does not explain why outcomes occurred, it provides the foundation for all advanced analytics.
2) Diagnostic Analytics
Diagnostic analytics goes a step deeper by identifying the factors that influenced performance. It focuses on understanding why specific outcomes occurred.
Key characteristics
- Examines relationships between metrics and variables.
- Identifies performance drivers, bottlenecks, and drop-off points.
- Uses techniques such as funnel analysis, cohort analysis, and attribution modeling.
In marketing, diagnostic analytics helps teams understand why conversion rates declined, why a campaign underperformed, or why a customer segment disengaged. As outlined in IBM’s diagnostic analytics framework, this approach uncovers patterns and correlations that explain changes in performance and takes analysis beyond surface-level reporting.
3) Predictive Analytics
Predictive analytics uses historical data, statistical methods, and machine learning models to estimate future outcomes. Instead of reacting to past performance, it enables teams to anticipate what is likely to happen.
Key characteristics
- Forecasts customer behavior, demand, and conversion likelihood.
- Predicts churn risk and identifies high-value or high-intent leads.
- Supports proactive planning and prioritization.
According to IBM’s predictive analytics overview, these models identify trends and probabilities that help organizations make forward-looking decisions. In marketing, predictive analytics allows teams to plan campaigns, allocate resources, and engage customers before issues arise.
4) Prescriptive Analytics
Prescriptive analytics is focused on recommending the best possible actions based on predicted outcomes and business objectives.
Key characteristics
- Combines predictive insights with optimization algorithms and business rules.
- Evaluates multiple decision scenarios.
- Recommends actions such as budget reallocation, channel mix optimization, and audience prioritization.
As explained in IBM’s prescriptive analytics framework, prescriptive analytics suggests the most effective course of action by weighing constraints, risks, and objectives. In mature analytics organizations, prescriptive analytics directly influences decision-making and maximizes ROI and operational efficiency.
How to Segment Audience using Marketing Analytics?
Audience segmentation using marketing analytics allows businesses to move from broad targeting to precision-driven personalization. Instead of guessing who customers are, organizations now use real behavioral, transactional, and engagement data to group audiences based on intent, value, and likelihood to convert.
What is Audience Segmentation?
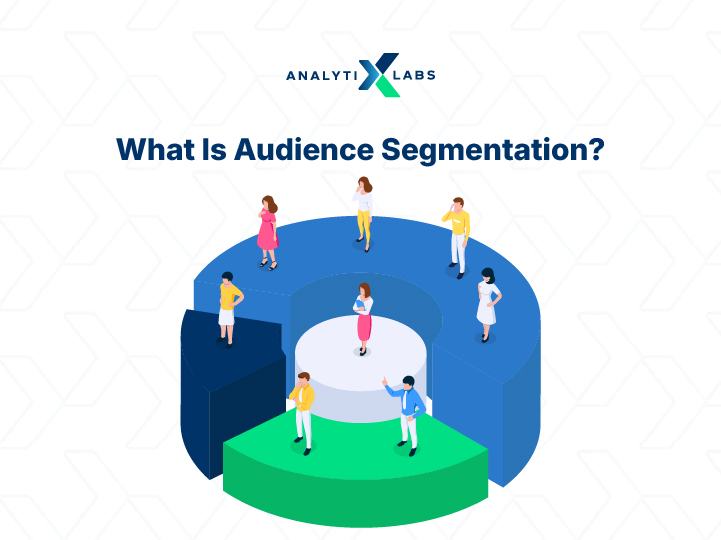
Audience segmentation is the process of organizing customers into distinct, data-backed groups that share meaningful characteristics. These characteristics typically fall into five categories:
- Demographic: Age, role, income, education
- Geographic: Location, language, regional behavior
- Behavioral: Browsing patterns, engagement frequency, content consumption
- Transactional: Purchase history, order value, renewal cycles
- Psychographic: Interests, preferences, motivations
Traditional segmentation relied heavily on static attributes such as age, gender, or location. While useful, these signals rarely explain intent.
Modern marketing analytics platforms, such as Salesforce Marketing Cloud, enable dynamic segmentation, where audience groups automatically update based on real-time behavior. For example:
- A user moves from “new visitor” to “high-intent lead” after repeated product views
- A customer shifts from “active buyer” to “churn risk” after engagement drops
Analytics-driven segmentation is data-led to ensure that:
- Messaging aligns with current customer intent, not outdated or generic profiles.
- Offers are relevant to where customers are in their buying journey.
- Channels are chosen based on customer behavior, not assumptions.
How Marketing Analytics Improves Audience Segmentation?
Marketing analytics strengthens segmentation by revealing patterns that are not visible in surface-level data. Instead of asking “Who are our customers?”, analytics helps answer “Which customers matter most right now and why?”
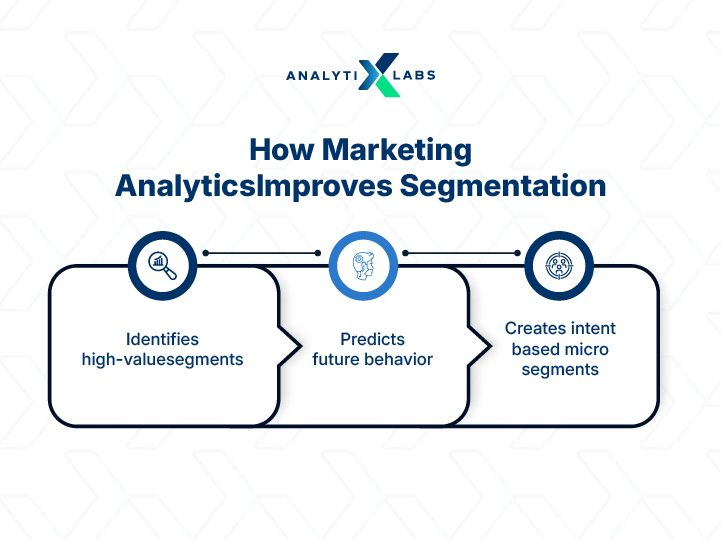
The key ways in which marketing analytics enhances segmentation are:
-
Identifies high-value segments: Analytics links segmentation to metrics such as customer lifetime value (LTV), repeat purchase rate, and profitability, helping teams focus on revenue-driving audiences.
-
Predicts future behavior: Predictive models identify segments likely to convert, churn, or upgrade, allowing proactive campaign planning.
-
Creates intent-based micro-segments: Divides customers into highly granular groups based on predicted purchase intent signals like cart abandonment, repeated product views, or trial users in the consideration stage. This enables hyper-targeted campaigns that predict and influence buying behavior with precision.
Tools like HubSpot Marketing Hub enable marketers to merge segmentation with performance metrics such as conversion rates and customer lifetime value. This approach makes segmentation measurable and continuously improvable, enhancing campaign personalization. By refining strategies based on real-time insights, marketers achieve greater relevance, efficiency, and long-term customer value as behaviors evolve.
How to Implement Marketing Analytics for Your Business?
Implementing marketing analytics requires a structured approach that combines technology, process, and organizational alignment. The following steps provide a practical framework for building analytics capabilities that scale with business growth. If you’re unsure how to interpret data or plan your analytics strategy, using an AI Chat tool can help simplify complex concepts, generate insights, and guide decision-making in real time.
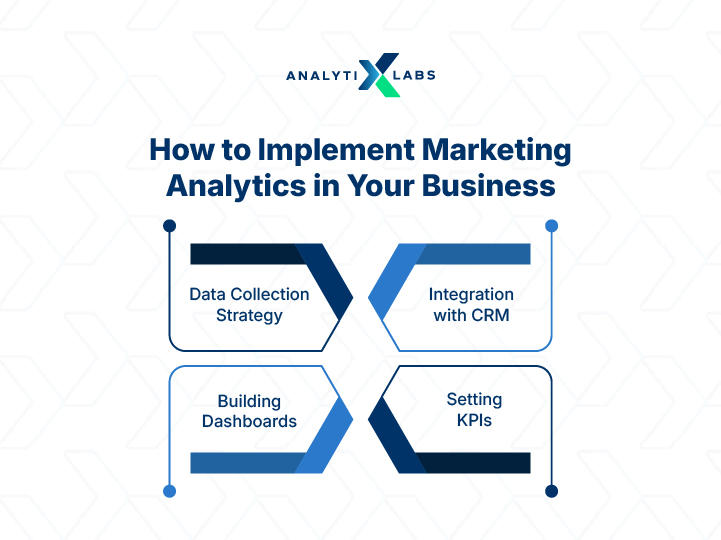
1) Data Collection Strategy
Effective marketing analytics begins with comprehensive data collection across all customer touchpoints. Organizations should implement tracking on websites, mobile apps, email campaigns, social media, and advertising channels. Tools like Google Tag Manager enable centralized tracking management without extensive technical resources. Establish clear data governance policies to ensure accuracy, consistency, and compliance. Prioritize first-party data collection as third-party cookie deprecation continues.
2) Integration with CRM
Connecting marketing analytics with customer relationship management systems unifies customer interactions across the entire lifecycle. Platforms like Salesforce CRM and HubSpot enable data flow between marketing and sales teams, ensuring attribution accuracy and closed-loop reporting. Integration allows marketers to track lead quality, conversion paths, and revenue impact. Automated data synchronization eliminates manual reporting errors and provides real-time visibility into campaign performance.
3) Building Dashboards
Marketing dashboards consolidate key metrics into accessible, visual formats that support quick decision-making. Use platforms like Google Looker Studio, Tableau, or Power BI to create customized dashboards tailored to specific roles and objectives. Executive dashboards should focus on high-level KPIs such as ROI and customer acquisition cost, while campaign managers need granular performance data. Ensure dashboards update in real-time to enable agile optimization.
4) Setting KPIs
Establish key performance indicators that align marketing activities with business objectives. Effective KPIs should be specific, measurable, achievable, relevant, and time-bound. According to HubSpot’s marketing KPI guide, common marketing KPIs include customer acquisition cost (CAC), customer lifetime value (LTV), return on ad spend (ROAS), conversion rate, and marketing qualified leads (MQLs). Avoid vanity metrics such as followers or website visits without conversion context. Regularly review and refine KPIs as business priorities evolve.
Understanding the Marketing Analytics Dashboard
Marketing analytics dashboards transform raw data into clear, decision-ready insights. They provide marketers and business leaders with a consolidated view of performance across channels, helping teams monitor progress, identify issues, and optimize strategies in real time.
What Is a Marketing Analytics Dashboard?
A marketing analytics dashboard is a visual interface that aggregates data into a single, easy-to-understand view. It typically pulls information from web analytics tools, advertising platforms, CRM systems, and marketing automation software. Tools like Google Looker Studio enable faster decision-making by presenting key trends, comparisons, and anomalies without requiring manual data analysis. Effective dashboards are role-based, meaning executives, marketers, and analysts each see metrics relevant to their responsibilities.
Essential Metrics to Include
An effective marketing analytics dashboard focuses on metrics that directly reflect business outcomes. Commonly tracked metrics include click-through rate (CTR), conversion rates, customer acquisition cost (CAC), return on ad spend (ROAS), and customer lifetime value (LTV). According to HubSpot’s marketing metrics guide, dashboards should align metrics with business goals to avoid data overload. When dashboards prioritize actionable KPIs over vanity metrics, they become powerful tools for performance management rather than static reporting systems.
Top Marketing Analytics Tools
Selecting the right marketing analytics tools is critical for extracting actionable insights from marketing data. The following platforms offer industry-leading solutions for businesses of all sizes, budgets, and analytical needs:
- Google Analytics 4 is the most widely adopted web analytics platform, offering free access to website and app tracking, audience insights, and conversion measurement.
- HubSpot Marketing Hub combines analytics, marketing automation, CRM integration, and campaign management into a unified platform.
- Semrush specializes in competitive intelligence, SEO analytics, and digital marketing research.
- Zoho Analytics provides affordable business intelligence and data visualization capabilities suitable for small to mid-sized businesses.
- Salesforce Marketing Cloud delivers enterprise-grade analytics, customer data platforms, and AI-powered insights for large organizations with complex marketing ecosystems.
How to Choose the Right Marketing Analytics Tool?
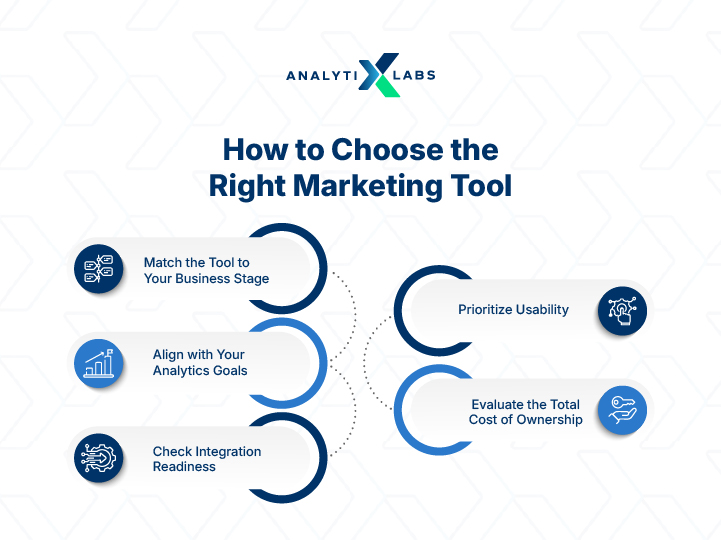
The right marketing analytics tool depends on business size, budget, technical expertise, and specific analytical requirements. The following steps will help you choose the right marketing analytics tool:
1. Match the Tool to Your Business Stage
- Small Businesses: Start with cost-effective tools like GA4 or Zoho Analytics for core tracking.
- Mid-Market Teams: Use platforms like HubSpot to combine analytics + automation.
- Enterprises: Choose scalable ecosystems like Salesforce Marketing Cloud for complex data and journeys.
2. Align with Your Analytics Goals: Make sure the tool meets your current needs, like tracking, attribution, and segmentation, and future needs such as prediction, personalization, and AI insights.
3. Check Integration Readiness: Must connect seamlessly with CRM, data warehouse, ad platforms, and CDPs.
4. Prioritize Usability: Easy dashboards, minimal learning curve, and strong documentation reduce adoption friction. Ensure non-technical teams use it without constant analyst support.
5. Evaluate the Total Cost of Ownership: Look beyond license fees and factor in implementation, training, and ongoing maintenance.
Does Market Mix Modelling (MMM) Use Marketing Analytics?
Market Mix Modelling (MMM) is a statistical analysis technique that uses marketing analytics to measure the impact of marketing activities on sales outcomes. It quantifies how different channels, from television, digital advertising, social media, and promotions, contribute to overall performance.
How MMM Uses Marketing Analytics?
MMM uses advanced analytics methods, such as regression analysis, time-series modeling, and machine learning, to isolate the effects of individual marketing tactics while accounting for external factors like seasonality and competition.
According to NIQ’s marketing mix modeling solution, MMM platforms aggregate data from multiple marketing channels, sales systems, and external sources to build predictive models. These models help marketers grasp diminishing returns, optimal budget allocation, and the balance between long-term brand building and short-term sales. Marketing analytics provides the essential data infrastructure for MMM.
Practical Example
Consumer electronics brand LG Electronics worked with Accenture and Google to develop a custom MMM that reflected its complex business operations and various customer touchpoints.
According to Google’s marketing mix modelling guide, the analysis revealed that LG’s digital video ads drove return on ad spend between 1.7X and 3.6X compared to TV, with YouTube identified as a key driver of incremental revenue.
Similarly, beverage brand Nespresso discovered through MMM that its YouTube brand campaigns delivered 2X return on ad spend versus social media and 1.1X versus TV in South Korea.
Digital Marketing Analytics vs. Traditional Marketing Analytics
Digital marketing analytics and traditional marketing analytics differ fundamentally in data collection, measurement, and application. The following table highlights key distinctions:
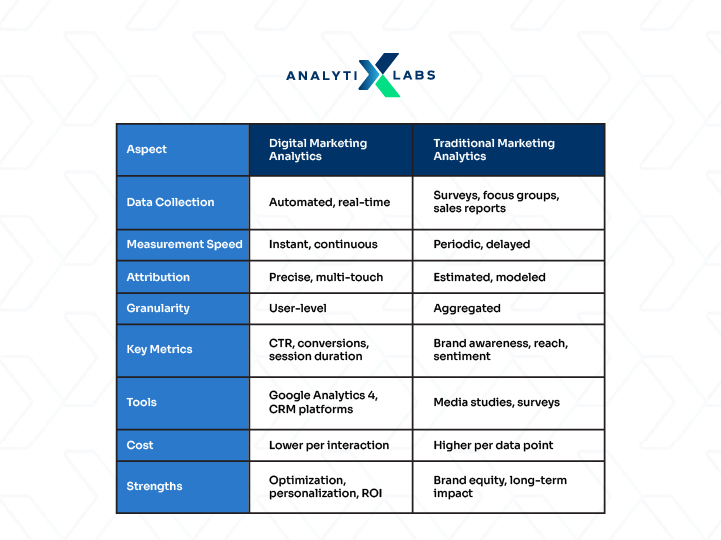
According to Nielsen’s marketing optimization solutions, leading marketers integrate both approaches to gain comprehensive insights across online and offline customer journeys.
Industry Use Cases of Marketing Analytics
Marketing analytics drives measurable growth across industries by transforming data into actionable insights tailored to sector-specific challenges.
1) E-commerce
E-commerce retailers use marketing analytics to combat cart abandonment and optimize product discovery. According to Barilliance’s e-commerce research, personalized product recommendations account for an average of 12% of e-commerce revenue, with leading brands achieving up to 31% in engaged sessions. Retailers analyze browsing patterns and purchase history to trigger automated cart recovery campaigns.
2) Banking/FinTech
Financial institutions leverage marketing analytics for fraud detection, credit risk assessment, and cross-selling optimization. Banks analyze transaction patterns and customer demographics to identify product opportunities. Research from McKinsey on cross-selling shows that effective cross-selling strategies can increase banking revenue by 20% and boost profits by 30% through precise targeting and personalized product recommendations.
3) Retail
Retail companies integrate online and offline data to optimize inventory and personalize experiences. Analytics platforms track foot traffic patterns, seasonal demand, and regional preferences. According to Salesforce Retail solutions, retailers using unified analytics improve inventory management and increase same-store sales through location-based promotions and dynamic pricing strategies informed by real-time demand signals.
4) SaaS/Tech
SaaS businesses use product usage analytics to reduce churn and identify expansion opportunities. Companies analyze feature adoption rates, login frequency, and support patterns to predict churn risk. According to QuantLedger’s churn prevention research, businesses that implement data-driven churn prevention strategies can reduce customer churn by 25-40% through targeted intervention campaigns and improved onboarding experiences.
5) Hospitality & Travel
Hotels and airlines employ marketing analytics for dynamic pricing and demand forecasting. Analytics platforms analyze booking patterns, seasonal trends, and competitor pricing to optimize rates in real time. According to HotelTech News research, hotels using AI-driven revenue management tools report an estimated 17% increase in total revenue compared to traditional methods.
Challenges in Marketing Analytics
Despite its value, marketing analytics implementation faces obstacles such as:
- Data Silos: Customer data lives across disconnected tools, limiting a unified view.
- Attribution Complexity: Multi-touch journeys make it hard to assign accurate credit to campaigns or channels.
- Privacy Constraints: Regulations such as GDPR and CCPA limit tracking and reduce visibility into user behavior.
- Skill Gaps: Effective analytics requires an understanding of data, statistical, and marketing expertise.
- Poor Data Quality: Incomplete, inconsistent, or inaccurate data weakens insights and decision confidence.
Career in Marketing Analytics
Marketing analytics is a fast-growing career due to businesses’ need for data-driven decisions. Professionals in this field connect marketing strategies with data science to generate valuable insights. Organizations now expect marketing teams to demonstrate ROI, forecast outcomes, and optimize spending, increasing the demand for experts who can translate data into actionable decisions.
Common Roles in Marketing Analytics
Progression in marketing analytics roles moves from descriptive to predictive, then to prescriptive work as seniority increases. Common roles are:
- Marketing/ Digital Analyst: Reporting, dashboards, performance tracking.
- Customer or Growth Analyst: Segmentation, funnel analysis, LTV modeling.
- Marketing Data Scientist: Predictive modeling, experimentation, churn/propensity analysis.
- Analytics Lead/ Manager: Strategy, stakeholder alignment, analytics roadmap.
Skills Needed for Building a Marketing Analytics Career
The skills required to build a solid marketing analytics career span both technical and business domains. You must have:
- Core data skills: SQL for database querying, Python/R, data modeling, and statistics.
- Analytics stack: GA4, CDPs, CRM-linked analytics, BI tools such as Tableau or Power BI.
- Business translation: Marketing fundamentals, campaign strategy, stakeholder communication, and translating data into strategic recommendations.
Salary in Marketing Analytics
According to Glassdoor’s salary data, Marketing Analysts in India earn between ₹4-8 lakhs annually at the entry level, while experienced Marketing Analytics Managers command ₹12-25 lakhs. In the United States, salaries range from $57,000 to $95,000 for analysts and from $100,000 to $150,000 for senior positions.
Why the Marketing Analytics Career Path Works for Tech Professionals
The job market is growing because companies see analytics as crucial for effective marketing and improving ROI. Tech professionals adopting the marketing analytics career path get the following benefits:
- Direct crossover from data analytics, data science, and engineering roles, using familiar skills like SQL, Python, experimentation, and data modeling.
- Faster visibility of impact compared to backend-only analytics roles.
- Strong alignment with AI, experimentation, and real-time decision systems.
Future of Marketing Analytics
Advances in artificial intelligence, automation, and privacy-first data strategies will drive the future of marketing analytics. AI-powered analytics will move beyond reporting to deliver predictive and prescriptive insights, enabling marketers to anticipate customer behavior and optimize campaigns in real time.
The rise of cookieless tracking and stricter data regulations will accelerate the adoption of first-party data and consent-driven measurement models. Integration of analytics with customer data platforms (CDPs) will create unified customer views across channels. As speed, accuracy, and accountability become critical, marketing analytics will evolve into a core driver of business strategy and competitive advantage.