Time Series Analysis is a method of examining the features of an independent variable, the response variable, with regard to time. It is mainly used as a strong reference in evaluating the targeted data and variables when predicting or forecasting. Moreover, time will be a prime factor when we are recording some data.
Time is a crucial element in time series analysis. It allows us to better understand our reality and how we evolve within it.
Forecasting and time series analysis are two of the most prevalent quantitative approaches used by organizations and scholars today. In this comprehensive guide we will look at what is time series analysis, the types of time series analysis, the importance of time series analysis, and time series models.
What is Time Series Analysis (TSA)?
A time series analysis is a way of studying a group of data points accumulated over time.
Moreover, it is specifically used for non-stationary data, i.e., the data that keeps changing over a certain period of time. This factor also makes the time series data differ from any other data.
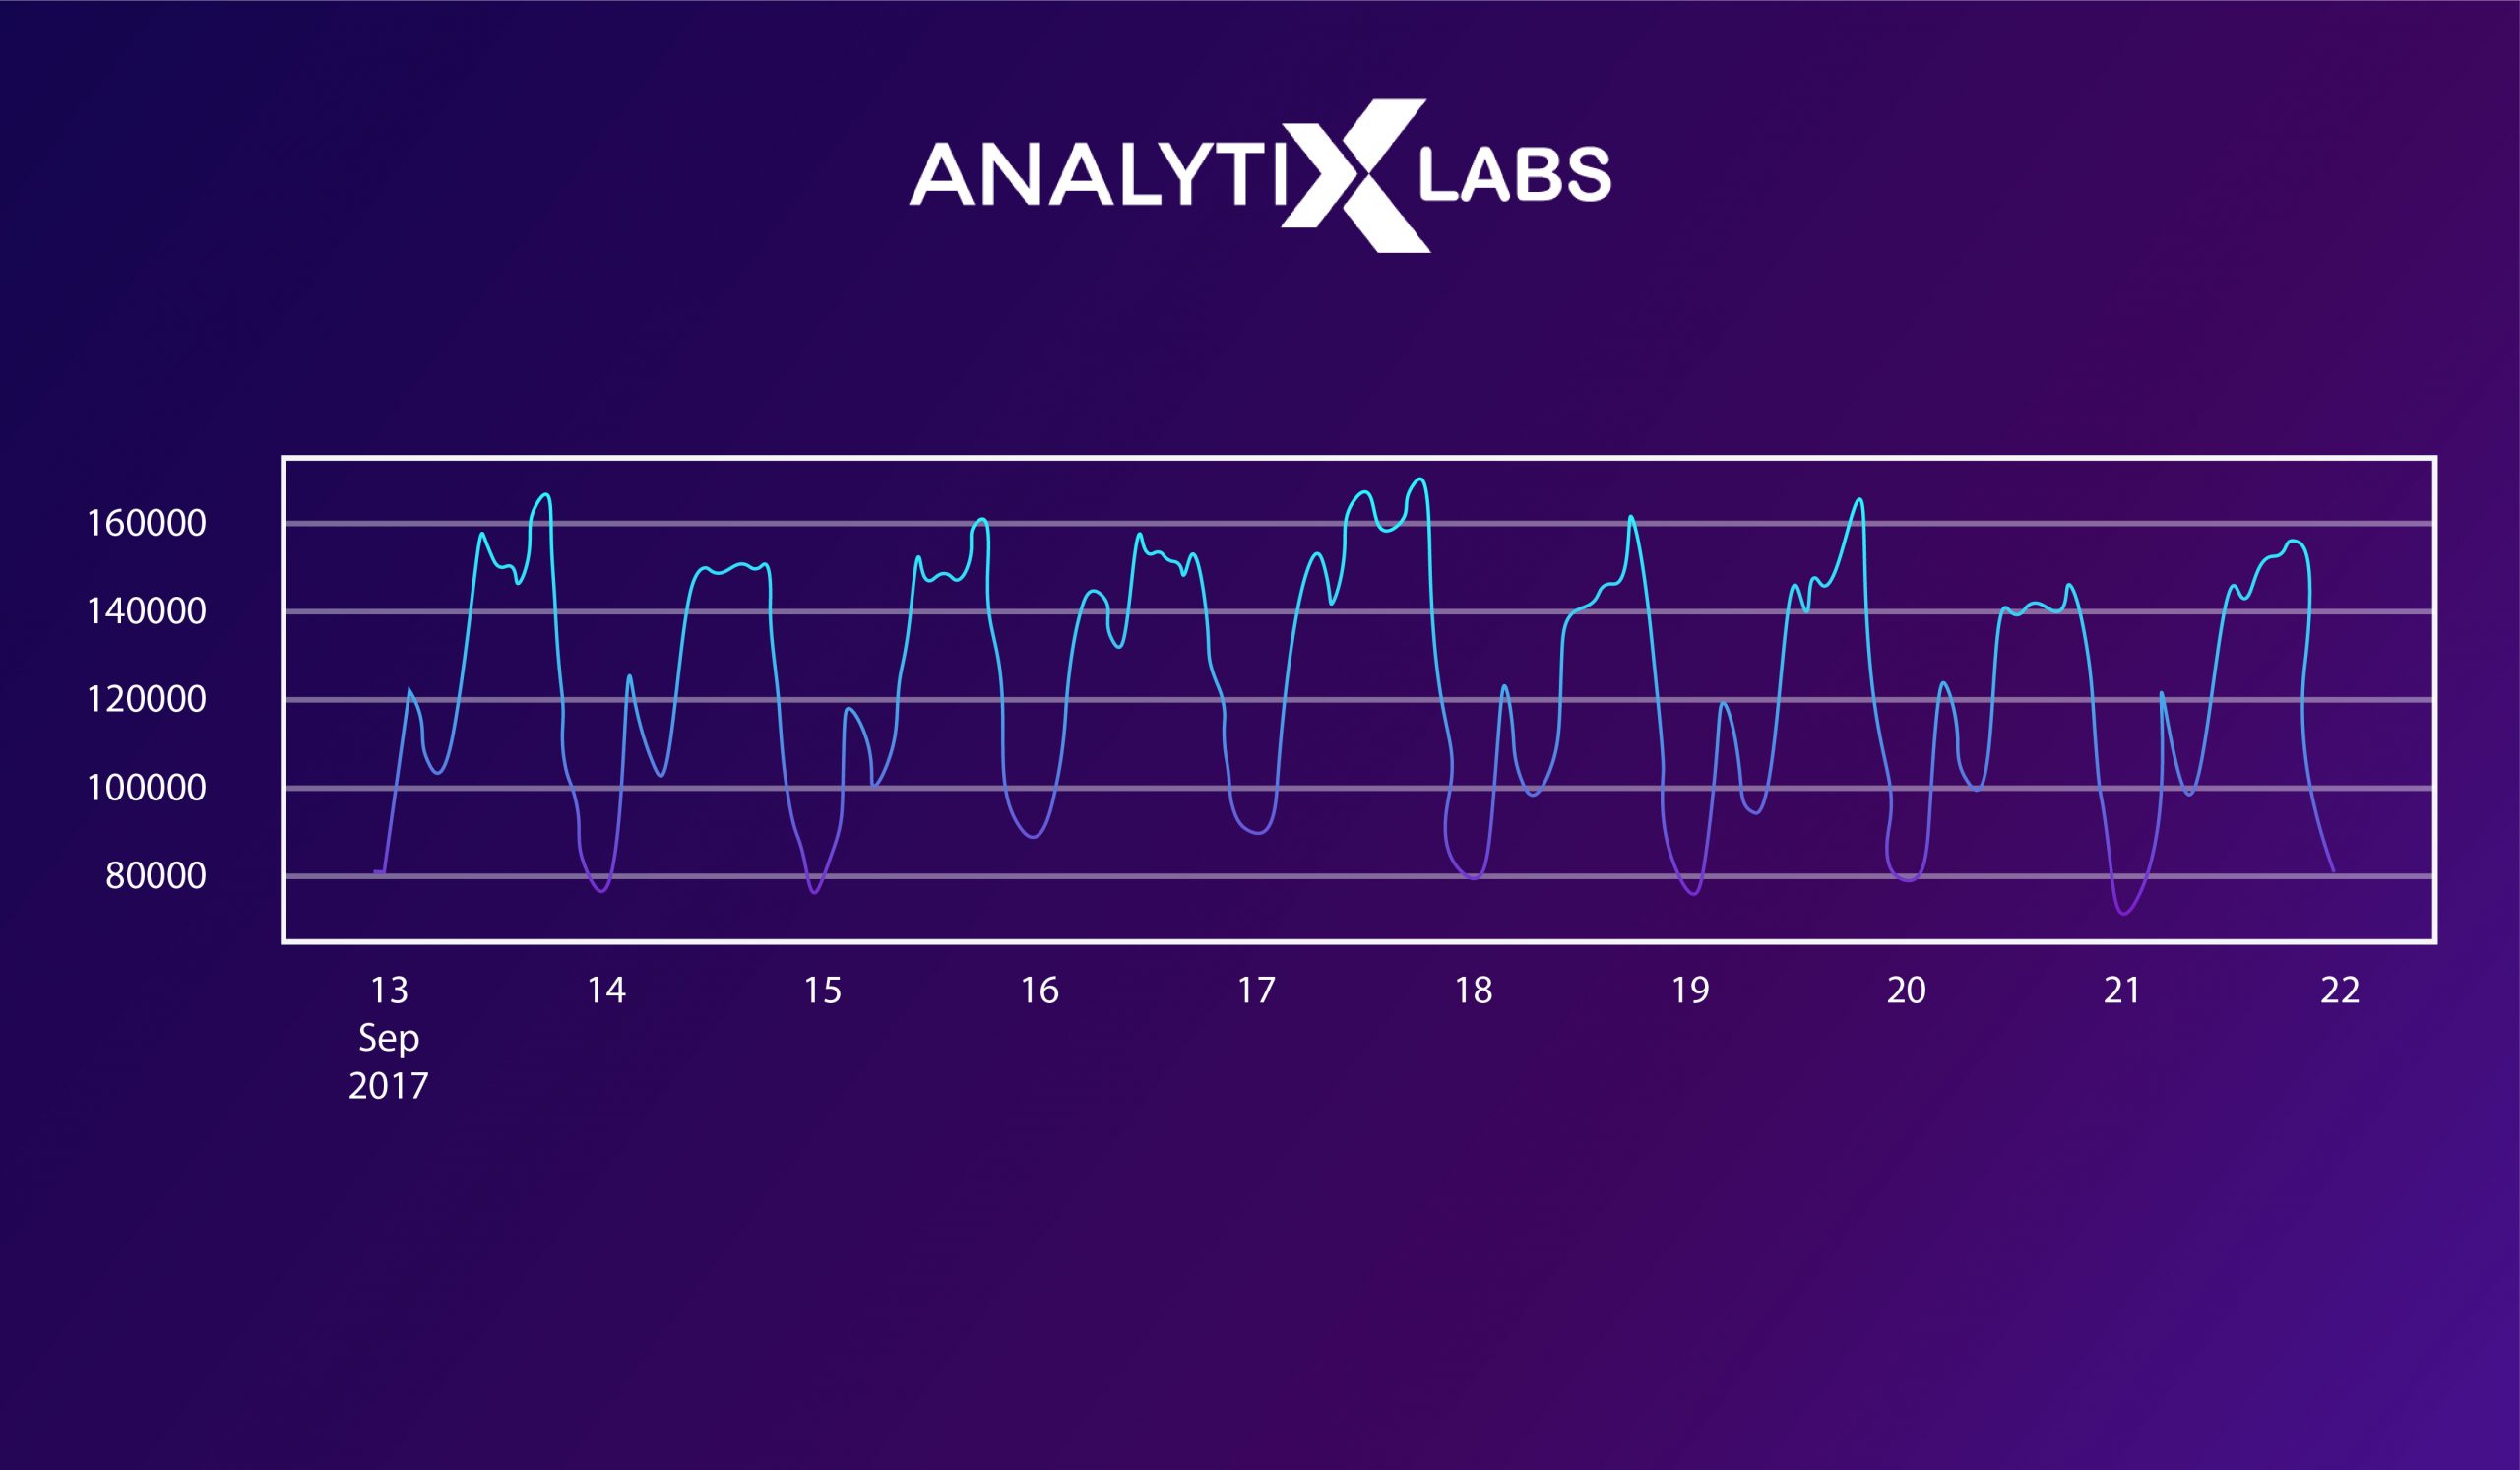
Furthermore, time series analysis is used to forecast future data based on prior data . Therefore, we can say that it is beyond the process of only collecting data.
Time series analysis is a subfield of predictive analytics. It helps in predicting expected changes in data, such as seasonality or cyclic behavior, which provides a deeper knowledge of the variables and aids in forecasting.
Types of Time Series Analysis
Since various types of data are collected in time series, analysts have made some complex models for better understanding. Analysts, on the other hand, cannot account for all fluctuations, nor can they generalize a given model to every sample. The common types of time series analysis are:
- Classification: This model is used for the identification of data. It also allocates categories to the data.
- Descriptive Analysis: As time series data has various components, this descriptive analysis helps to identify the varied patterns of time series including trend, seasonal, or cyclic fluctuations.
- Curve Fitting: Under this type of time series analysis, we generally plot data along some curve in order to investigate the correlations between variables in the data.
- Explanative Analysis: This model basically explains the correlations between the data and the variables within it, and also explains the causes and effects of the data on the time series.
- Exploratory Analysis: The main function of this model is to highlight the key features of time series data, generally in a graphic style.
- Forecasting: As the name implies, this form of analysis is used to forecast future data. Interestingly, this model uses the past data (trend) to forecast the forthcoming data, thus, projecting what could happen at future plot points.
- Intervention Analysis: This analysis model of time series denotes or investigates how a single incident may alter data.
- Segmentation: This type typically divides the data into several segments in order to display the underlying attributes of the original data.
- Data Variation: It includes
- Functional Analysis: It helps in the picking of patterns within data and also correlates a notable relationship.
- Trend Analysis: It refers to the constant movement in a specific direction. Trends are classified into two types: deterministic (determining core causes) and stochastic (inexplicable).
- Seasonal Variation: It defines event occurrences that specifically happen at certain and regular periods throughout the year.
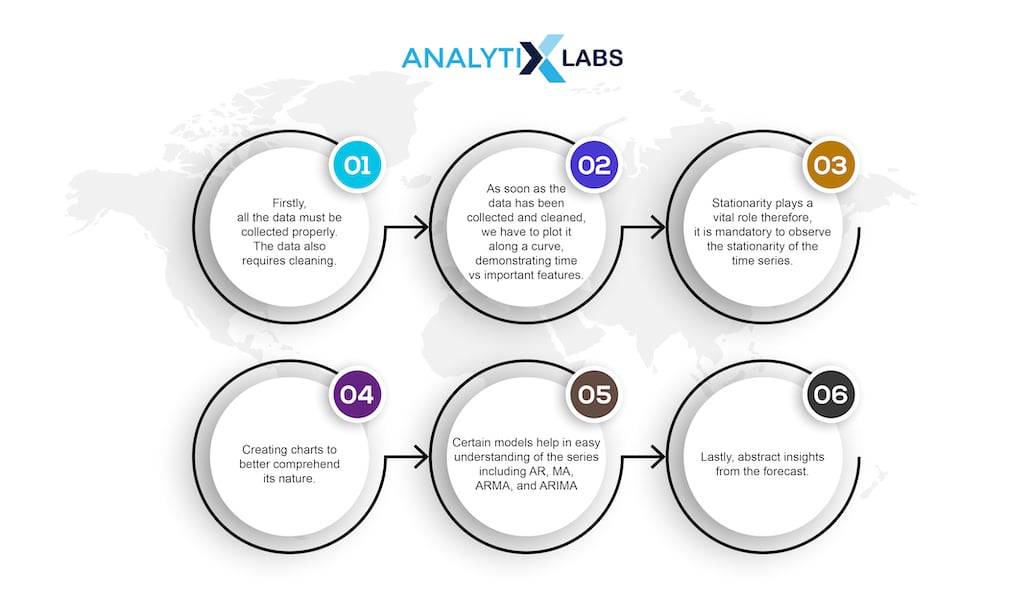
Steps to Analyze Time Series
Here’s a quick overview of the steps necessary for analyzing the time series.
Importance of Time Series Analysis
Many firms utilize it to anticipate their profit margin or loss patterns, allowing key business choices to be made for development. It is used to contrast the current trend with the previous trend so that the future trend may be estimated and planned.
It is also used to comprehend how an event’s characteristics might vary over time, and hence how dependability, flexibility, and other crucial characteristics can be predicted.
Value of Time Series Analysis
Time series analysis has a great impact on our lives. It helps organizations and companies scrutinize the core causes of trends or any methodical patterns over a period of time. Moreover, with all these data, you can plot them down in a chart visually and that helps in a deeper understanding of the market. This, in turn, will assist businesses in delving deeper into the underlying determinants of seasonal patterns or trends.
Besides, it also helps organizations to predict the future outcome of certain events. This may be accomplished by evaluating historical data during continual interludes. Thus, time series forecasting itself is a subpart of predictive analytics. It can foresee predicted variations in data, such as seasonality, trend, or cyclic behavior, allowing for more accurate data analysis and forecasting.
Furthermore, time series forecasting has other important aspects as well.
- Dependable: Time series forecasting is one of the most dependable processes in today’s market. It is reliable in the case where data signifies a long time period. Various important information can be extracted from the data fluctuations at regular intervals.
- Seasonal Patterns: Variations in data points signify a seasonal fluctuation which serves as the base for future predictions. This information is vital to the market where the product fluctuates seasonally, thus providing a general plan for production and other costs.
- Trend guesstimate: Time series analysis, in addition to seasonal patterns, aids in the identification of trends. This eventually will help the managers to track a record of the data tendencies where measurements demonstrate an increase or decrease in sales of a specific product.
- Growth: Another key value of time series analysis is that it also contributes to the financial as well as endogenous growth of a firm. Endogenous growth refers to the internal development of a company which in turn, led to financial capital growth. Fluctuations in policy variables can be notified through the time series analysis, which is a fine example of the importance of this series in various fields.
Time series analysis has marked its presence in various industries. It is widely used by statisticians for finding probability and other fundamentals. It is also essential in medical fields too.
Econometrics also uses the time series, thus it is also favored by mathematicians . It plays an important role in forecasting earthquakes and other natural calamities, guesstimating their areas of impact, and determining the patterns of weather for forecasting.
Components of Time Series Analysis
The components of the Time Series Analysis have been divided into the following:
-
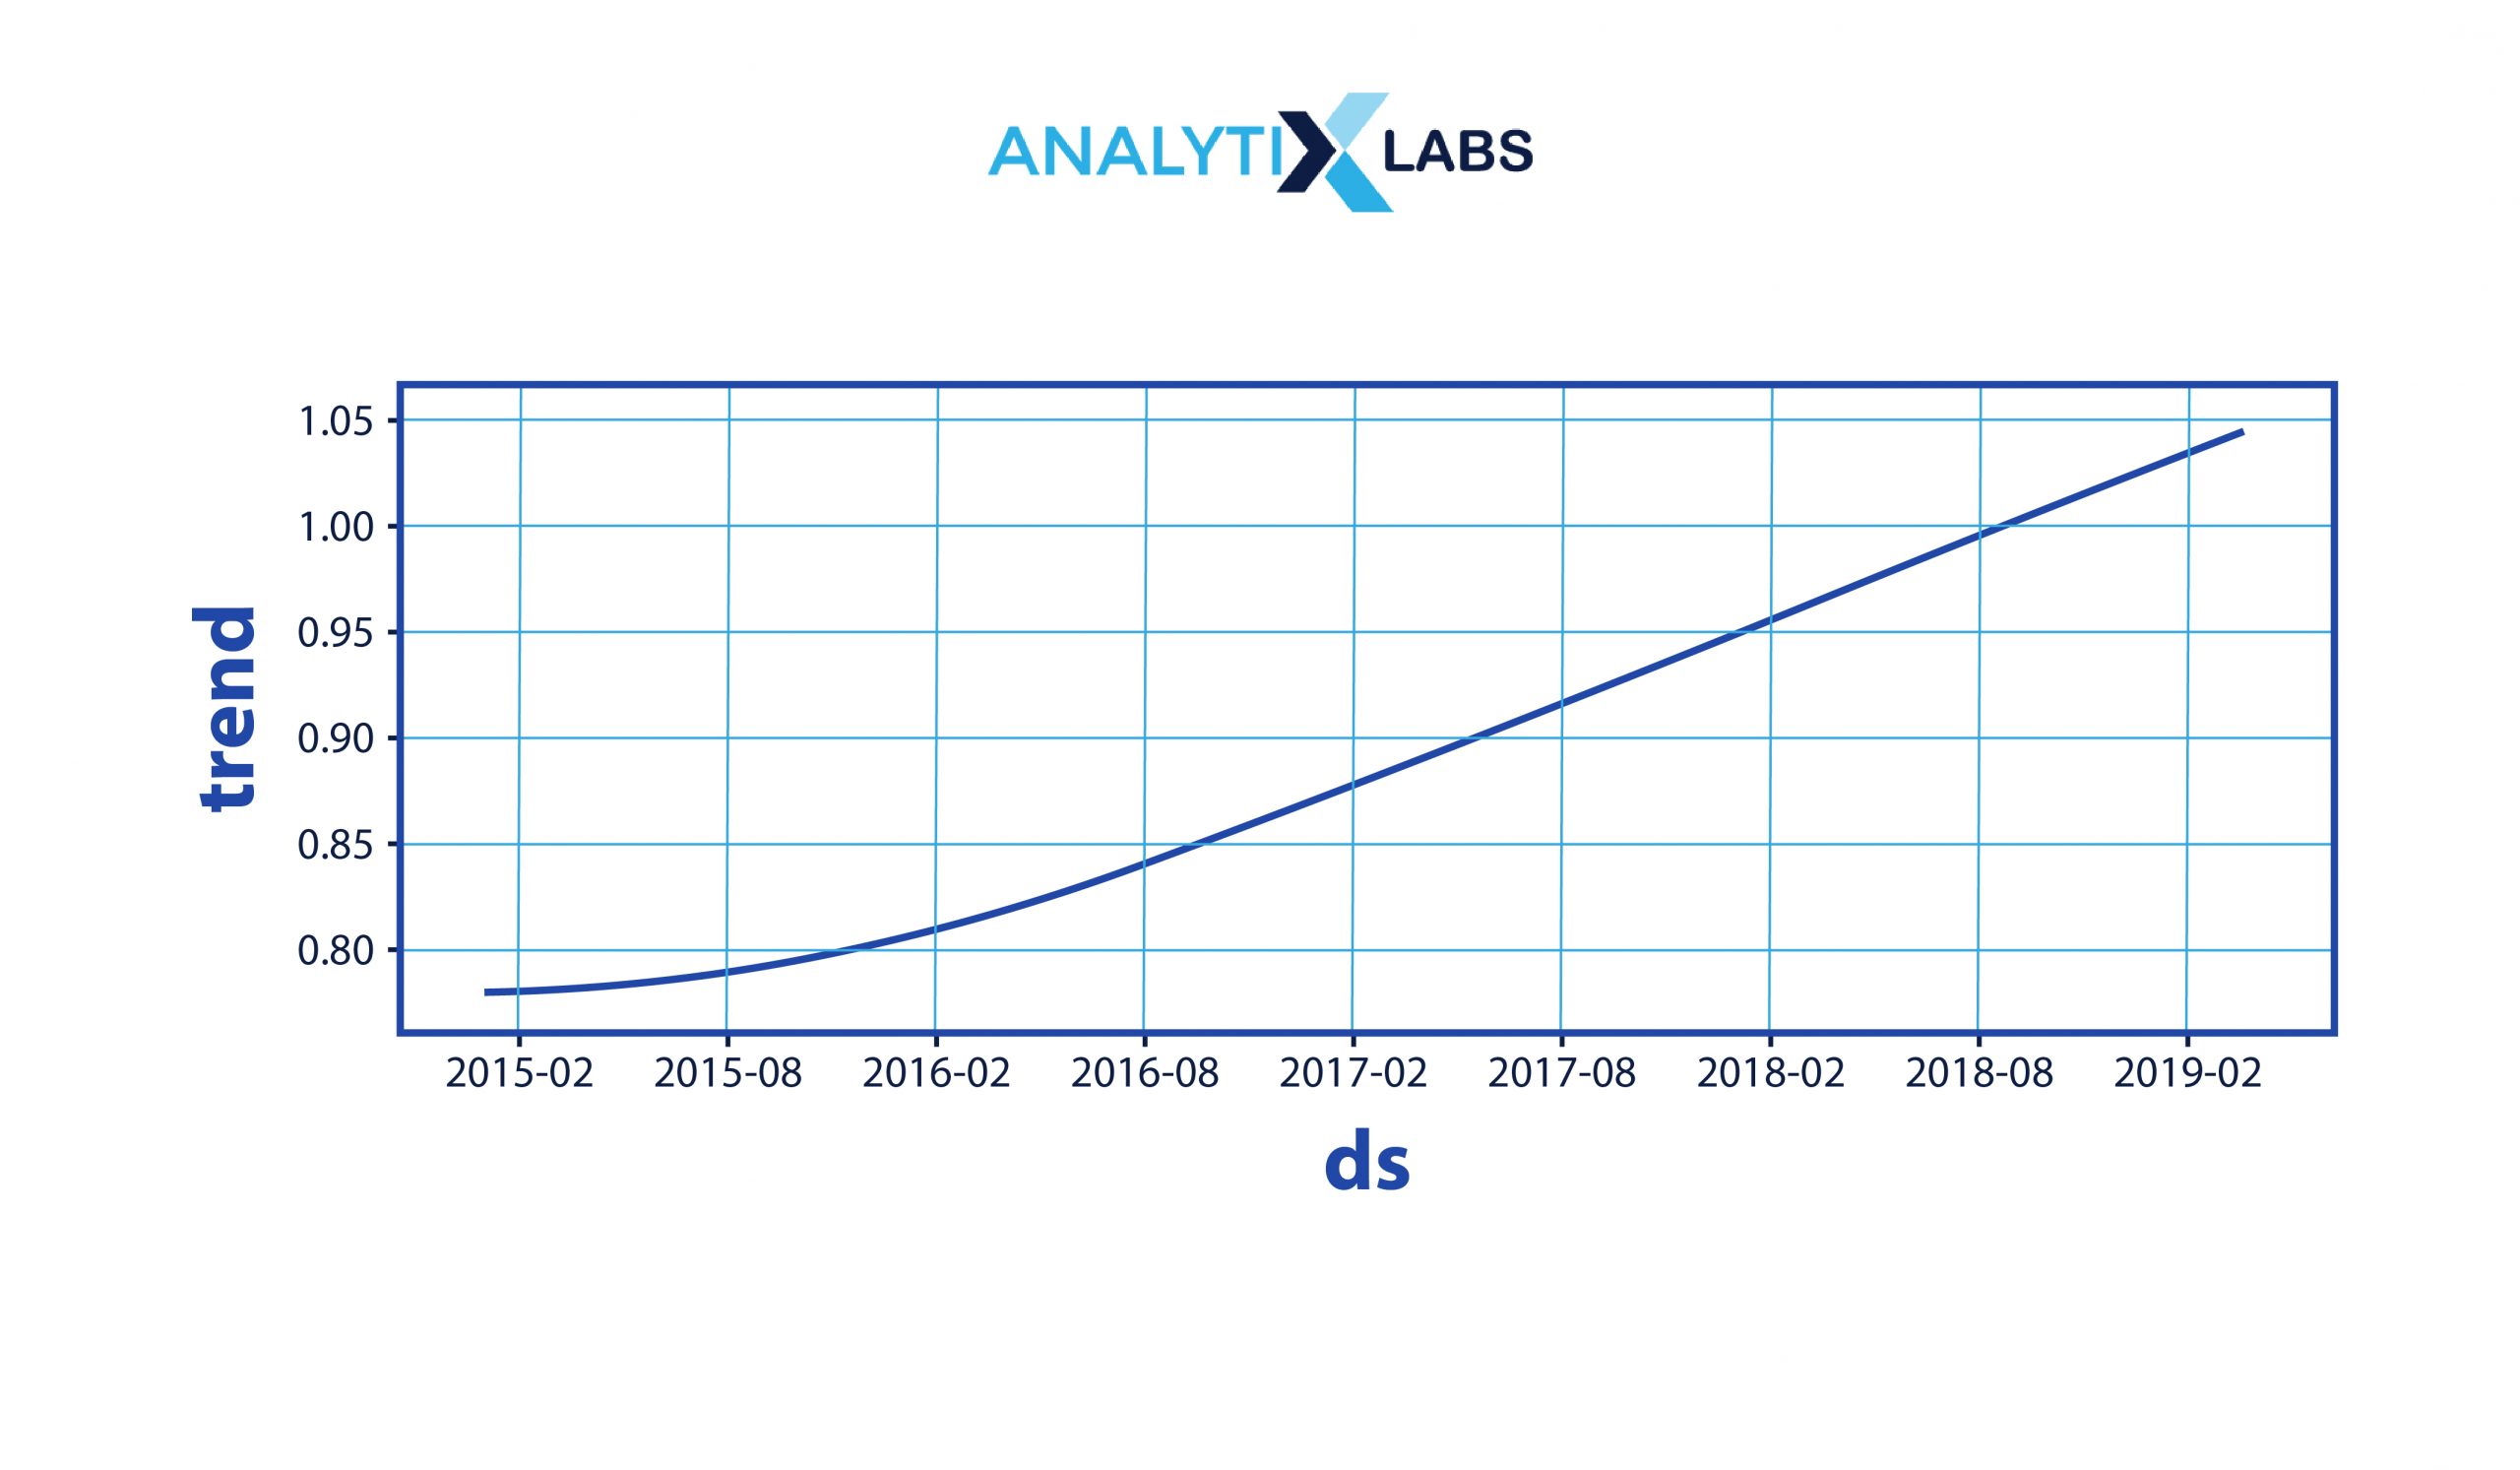
Trend
In a series, it is seen that the data has mainly two types of movement, upwards or downwards or sometimes it may remain stable. These movements are caused by certain factors namely environmental variations, population growth, fluctuations in stock markets, and many other reasons.
Hence, the Trend displays how data changes over time or how frequently data is being collected . It also shows the increment or decrement of data over time. A constant rise in the US stock market for the past 10 years is a classic example of a trend.
-
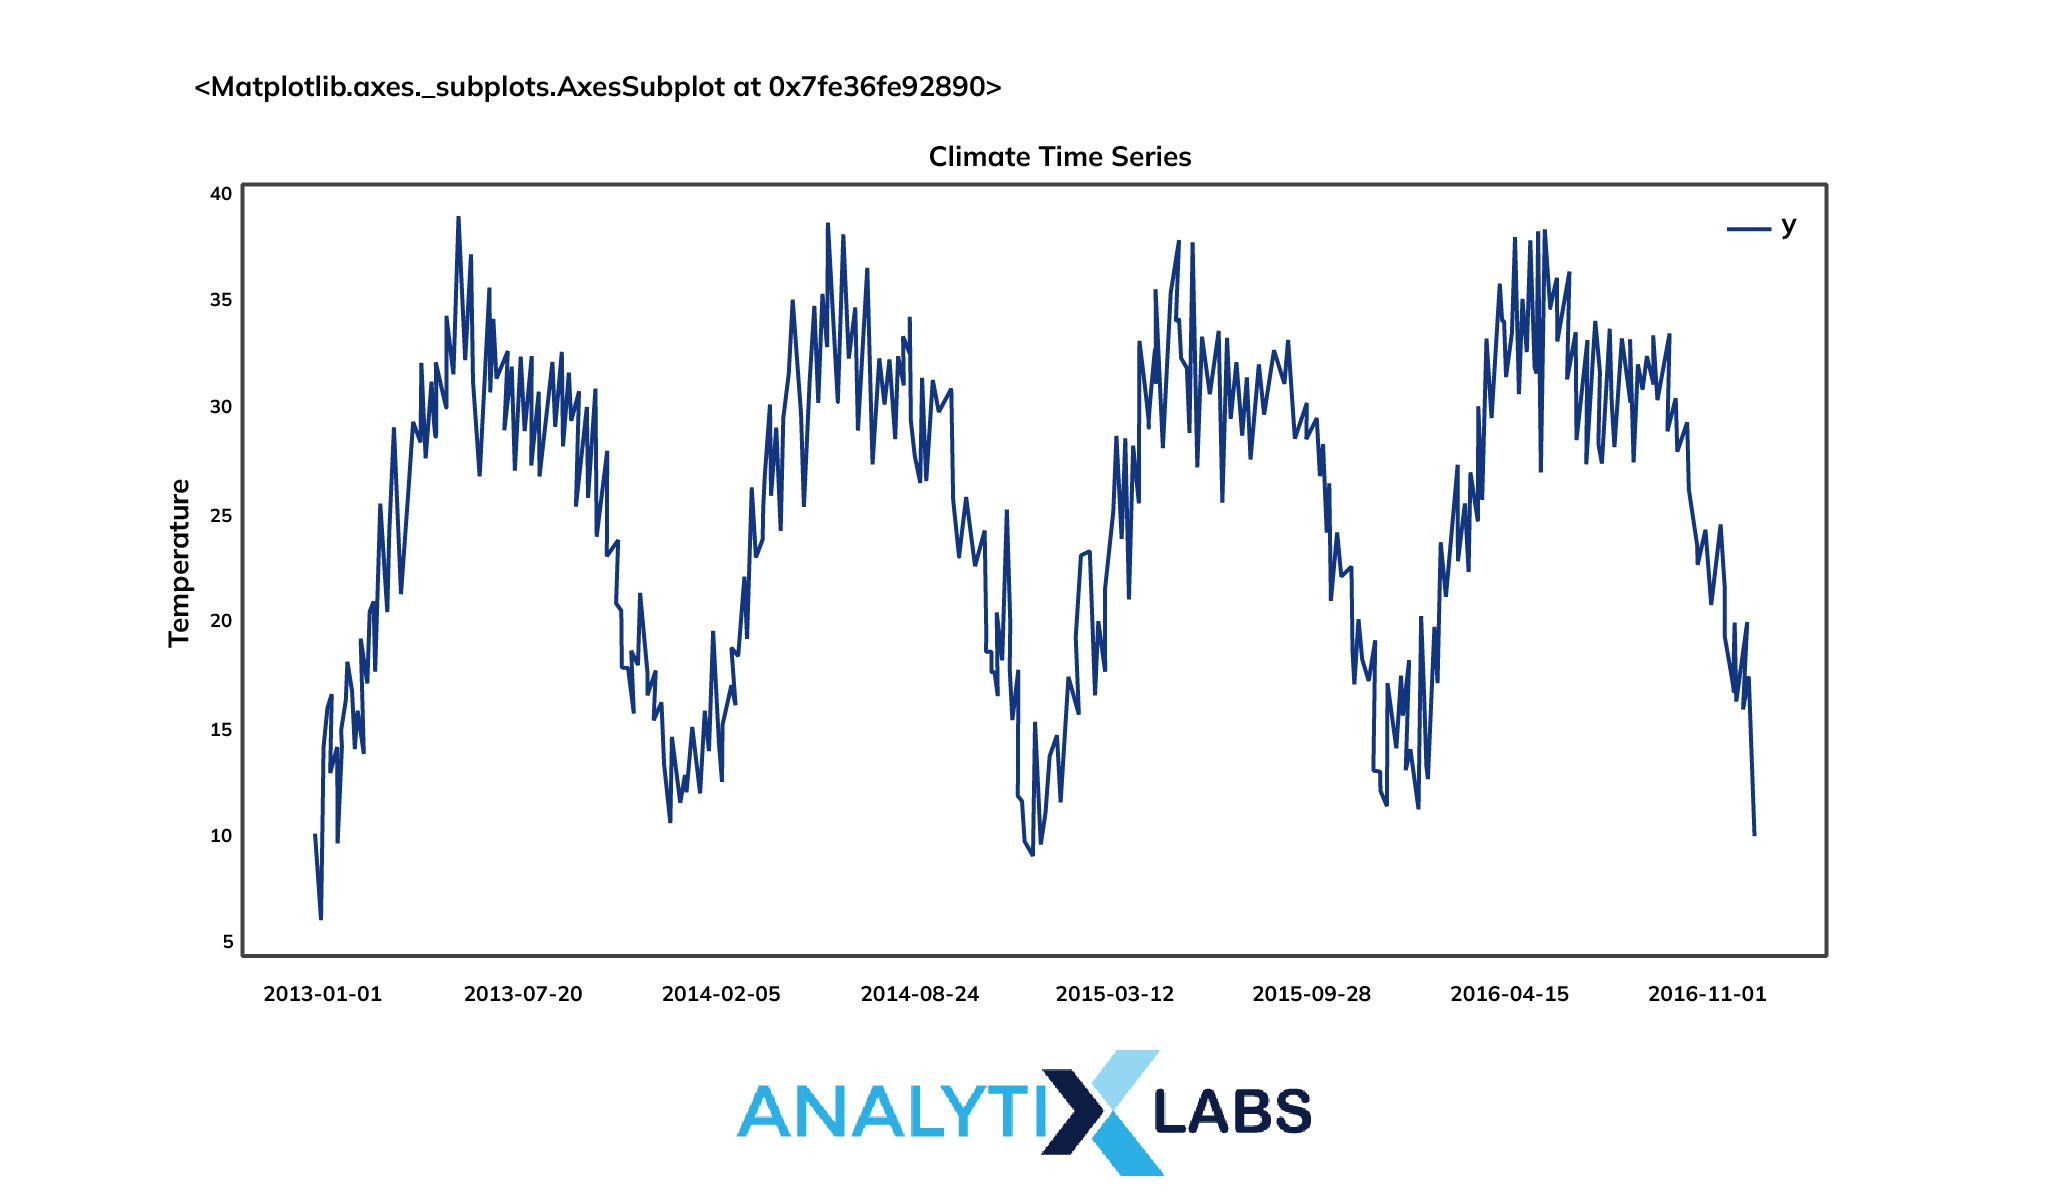
Seasonality
Surprisingly, the data and the calender goes side by side. In simpler words, the data is domain-specific and connected with calendar-related impacts, whether weekly, monthly, or seasonally.
Seasonality helps to identify differences that occur at predictable periods of time . A great example of seasonality is the colossal sale clocked by e-commerce sites during festivals.
Moreover, all these sheer variations generally take place around the same time frame and influence the data in precise, predictable ways.
-
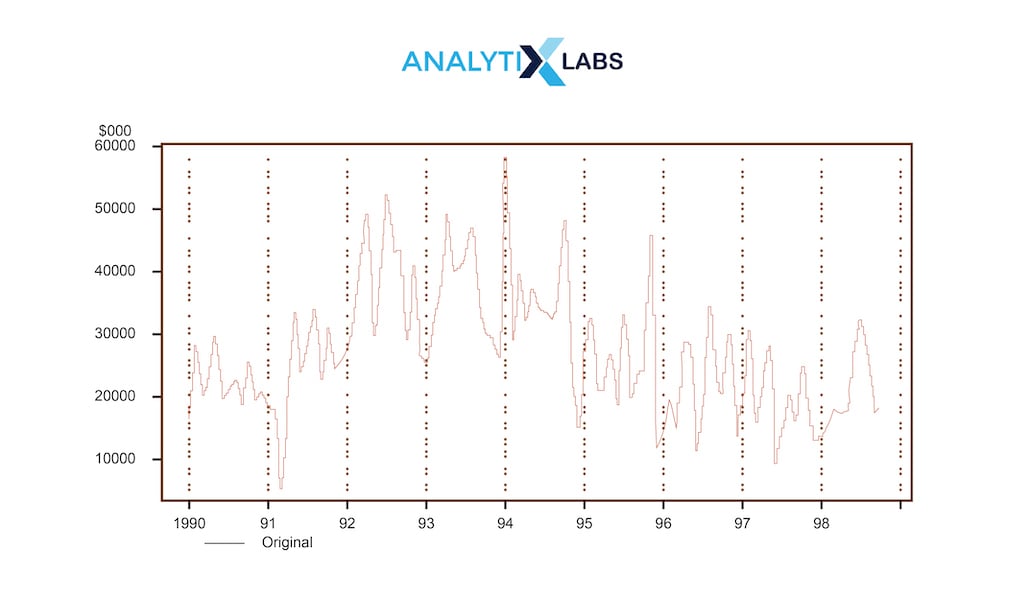
Irregularity
According to time series data analysis, all the variations of data in an irregular time series do not have any relation to trend or seasonality . Hence, all these fluctuations are purely haphazard and triggered due to some unforeseen causes.
Irregularity is also termed as noise in some cases.
A sudden decrement in the world population due to a serious pandemic seems to be a perfect example of this case.
White noise is another term associated with irregularity. It is an extreme kind of noise with no trend or seasonality . It is practically impossible to determine or predict white noise and therefore it is also stationary time series data.
-
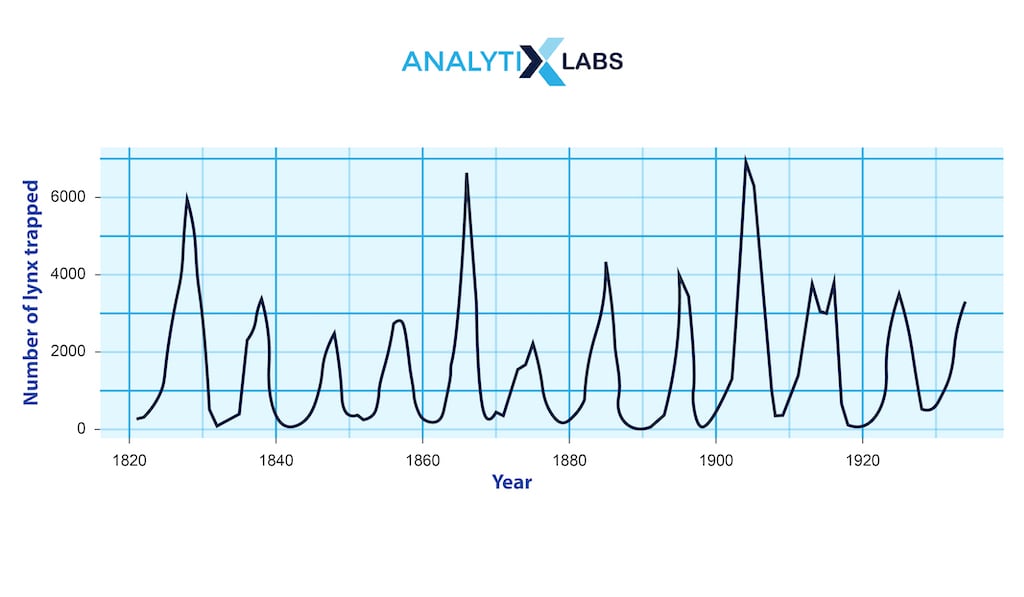
Cyclic
The term “cyclic” refers to time series oscillations that persist for more than a year. They might be recurring or not. This type of pattern occurs when the rise and falls are non-periodical. Mostly, a cyclic behavior lasts for at least a couple of years to be specific.
Cyclic and seasonal behavior may seem confusing but both are different.
- Cyclic behavior arises when the variations are non-periodical.
- When the fluctuations are unchanging, having some close relation with the calendar, then they are referred to as seasonal.
Apart from this, the magnitude and length of the patterns are different for cyclic and seasonal. Cyclic patterns have a longer length as compared to seasonal patterns and the magnitude of cyclic patterns is more variable than seasonal patterns .
-
Stationary
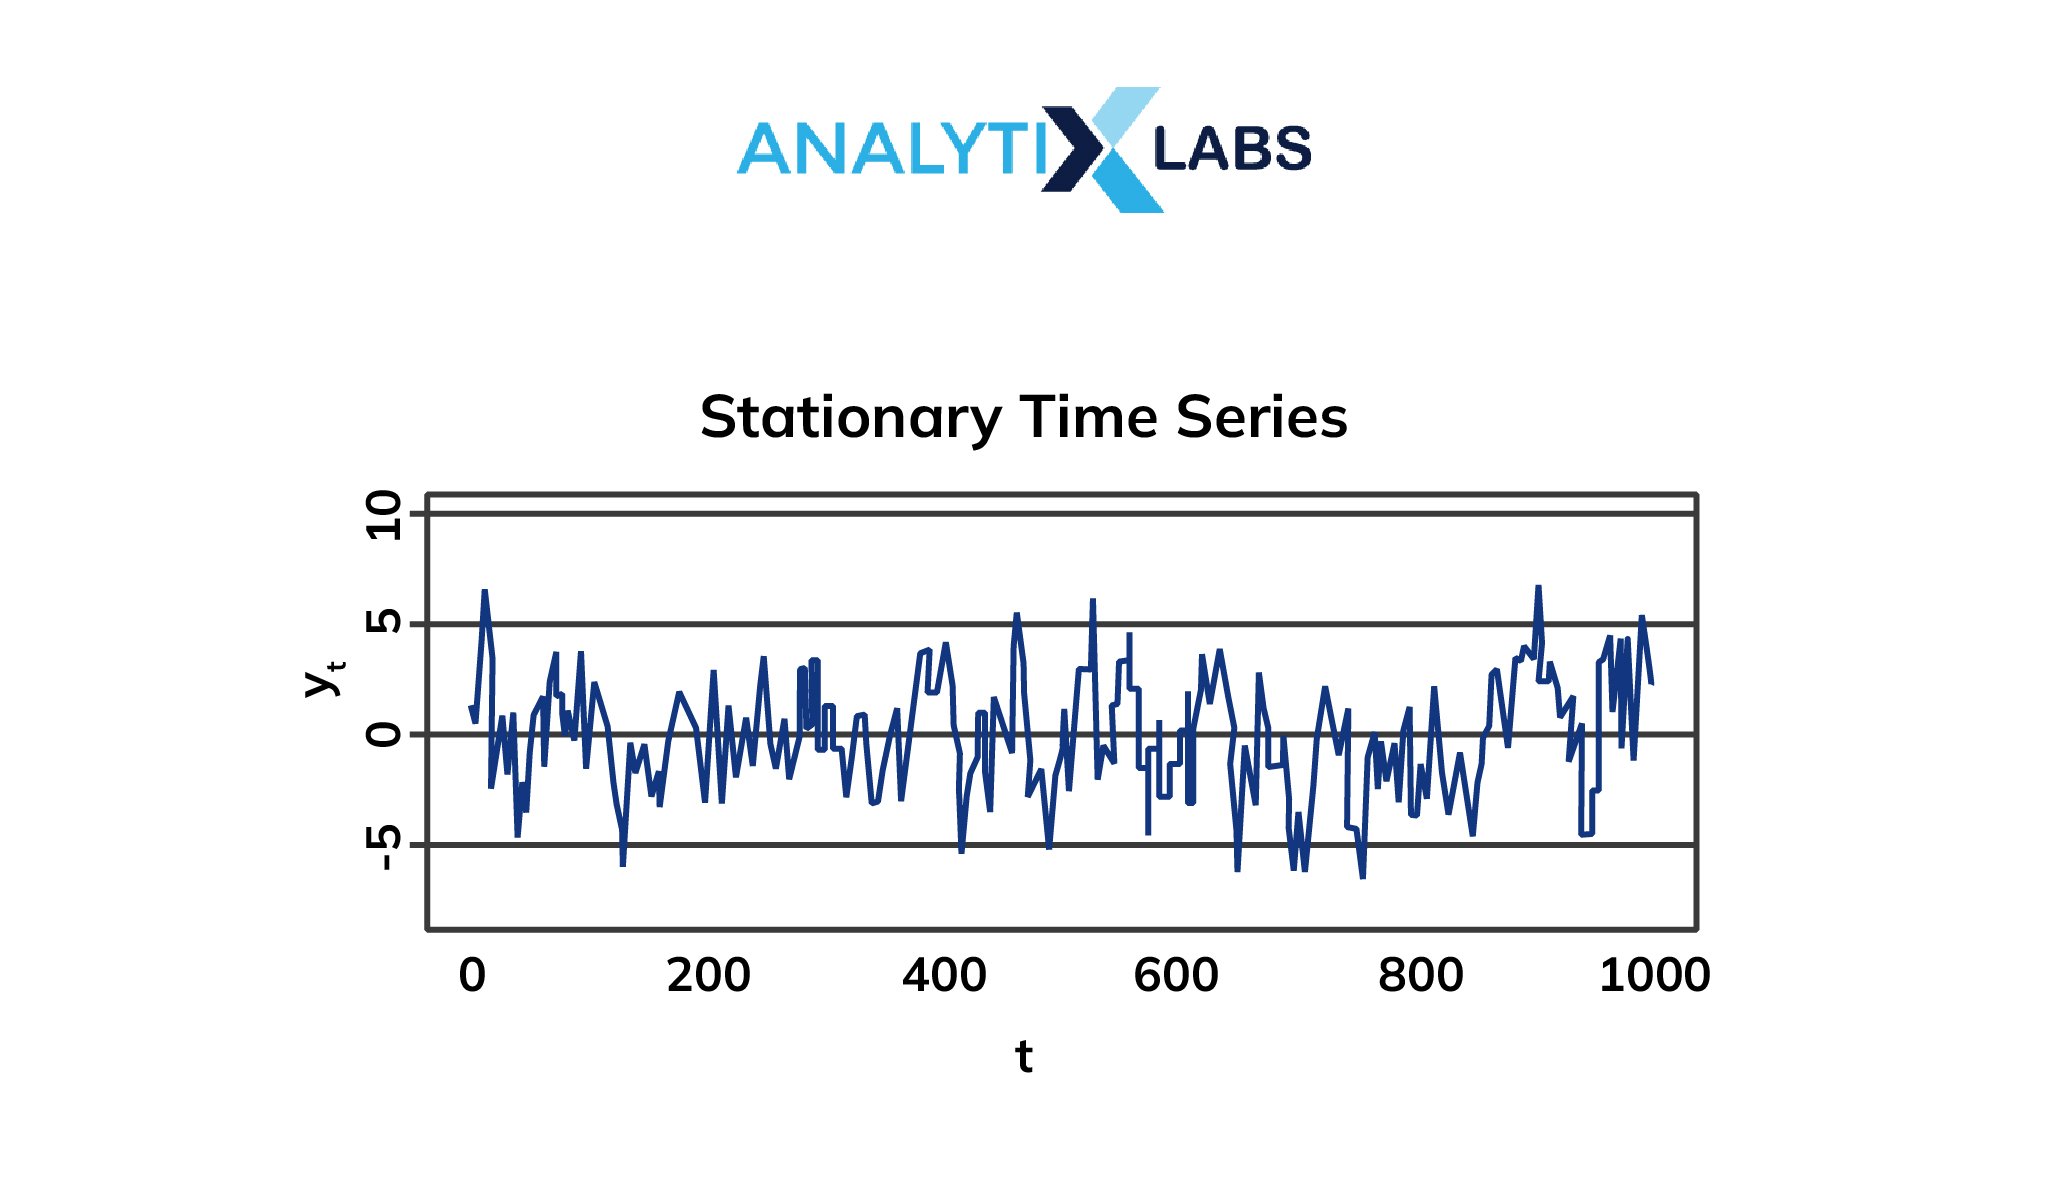
A time series that has statistical features that stay consistent across time is said to be stationary . Interestingly the traits remain the same throughout the series.
Moreover, another important aspect is that you can only be able to perform a time series analysis when the data is absolutely stationary. The mean, covariance, and variance of a stationary series are all constant.
Time Series Analysis Models and Techniques
There are several ways to study data in a time series. Here are some common time series models that can be used for data analysis:
1. Decompositional Models
The data of the time series denotes some patterns. Therefore it is quite helpful to break down the time series into various components for easy understanding. Each component denotes a specific pattern. This process is known as decompositional models. Primarily, the time series is divided into three major components namely trend, seasonal, and noise components. There are two forms of decomposition: the pace of change and predictability.
2. Smoothing-based Model
In time series, this method is one of the most statistical ones as it focuses on removing outliers from the time series data and making the pattern more clearly visible. Some random fluctuation is inherent in the collection of data throughout time. Therefore, smoothing data eliminates or decreases random fluctuation, revealing underlying patterns and cyclic components.
3. Moving Average Model
In the analysis of time series, the Moving Average or the MA model is a popular method for modeling univariate time series. According to the moving-average model, the predicted output is linearly correspondent with the current and other previous values of a probabilistic term.
4. Exponential Smoothing Model
Exponential smoothing is a simple approach for smoothing time series data that use the “exponential window function.” You can quite easily learn this procedure and can apply it to make a decision based on the user’s past expectations, such as seasonality. There are essentially three kinds of this model to be specific single, double, and triple exponential smoothing.
Besides, it is one of the key parts of the ARIMA and ARMA models. Likewise, this model is additionally utilized on account of the TBATS forecasting model.
5. ARIMA
ARMA is a truncation for AutoRegressive Integrated Moving Average. It is the most commonly used forecasting method in time series analysis. It is an amalgam of two models: The Moving Average Model and The Autoregressive Model.
Forecasts in an Autoregressive model are a linear mixture of historical values of the variable. Forecasts in a Moving Average model relate to a linear mixture of previous forecast mistakes.
Therefore, the model’s ultimate goal is to forecast forthcoming time series movement by studying disparities between values in the series rather than actual values. ARIMA models are used when there is evidence of non-stationarity in the data.
In addition to these, the SARIMA model or the Seasonal ARIMA model is used or extended by including a linear mixture of seasonal history values and/or prediction errors.
Time Series Analysis Example
The time analysis series plays a major role in our daily life. It is used in calculating retail sales, predicting stock prices, forecasting the weather, measuring heart rate, conducting subscriber analysis, and much more.
- In retail sales, this series is very vital as it denotes the total sale trend over time.
- In the stock market, it is commonly used by traders to understand the various patterns of stock prices.
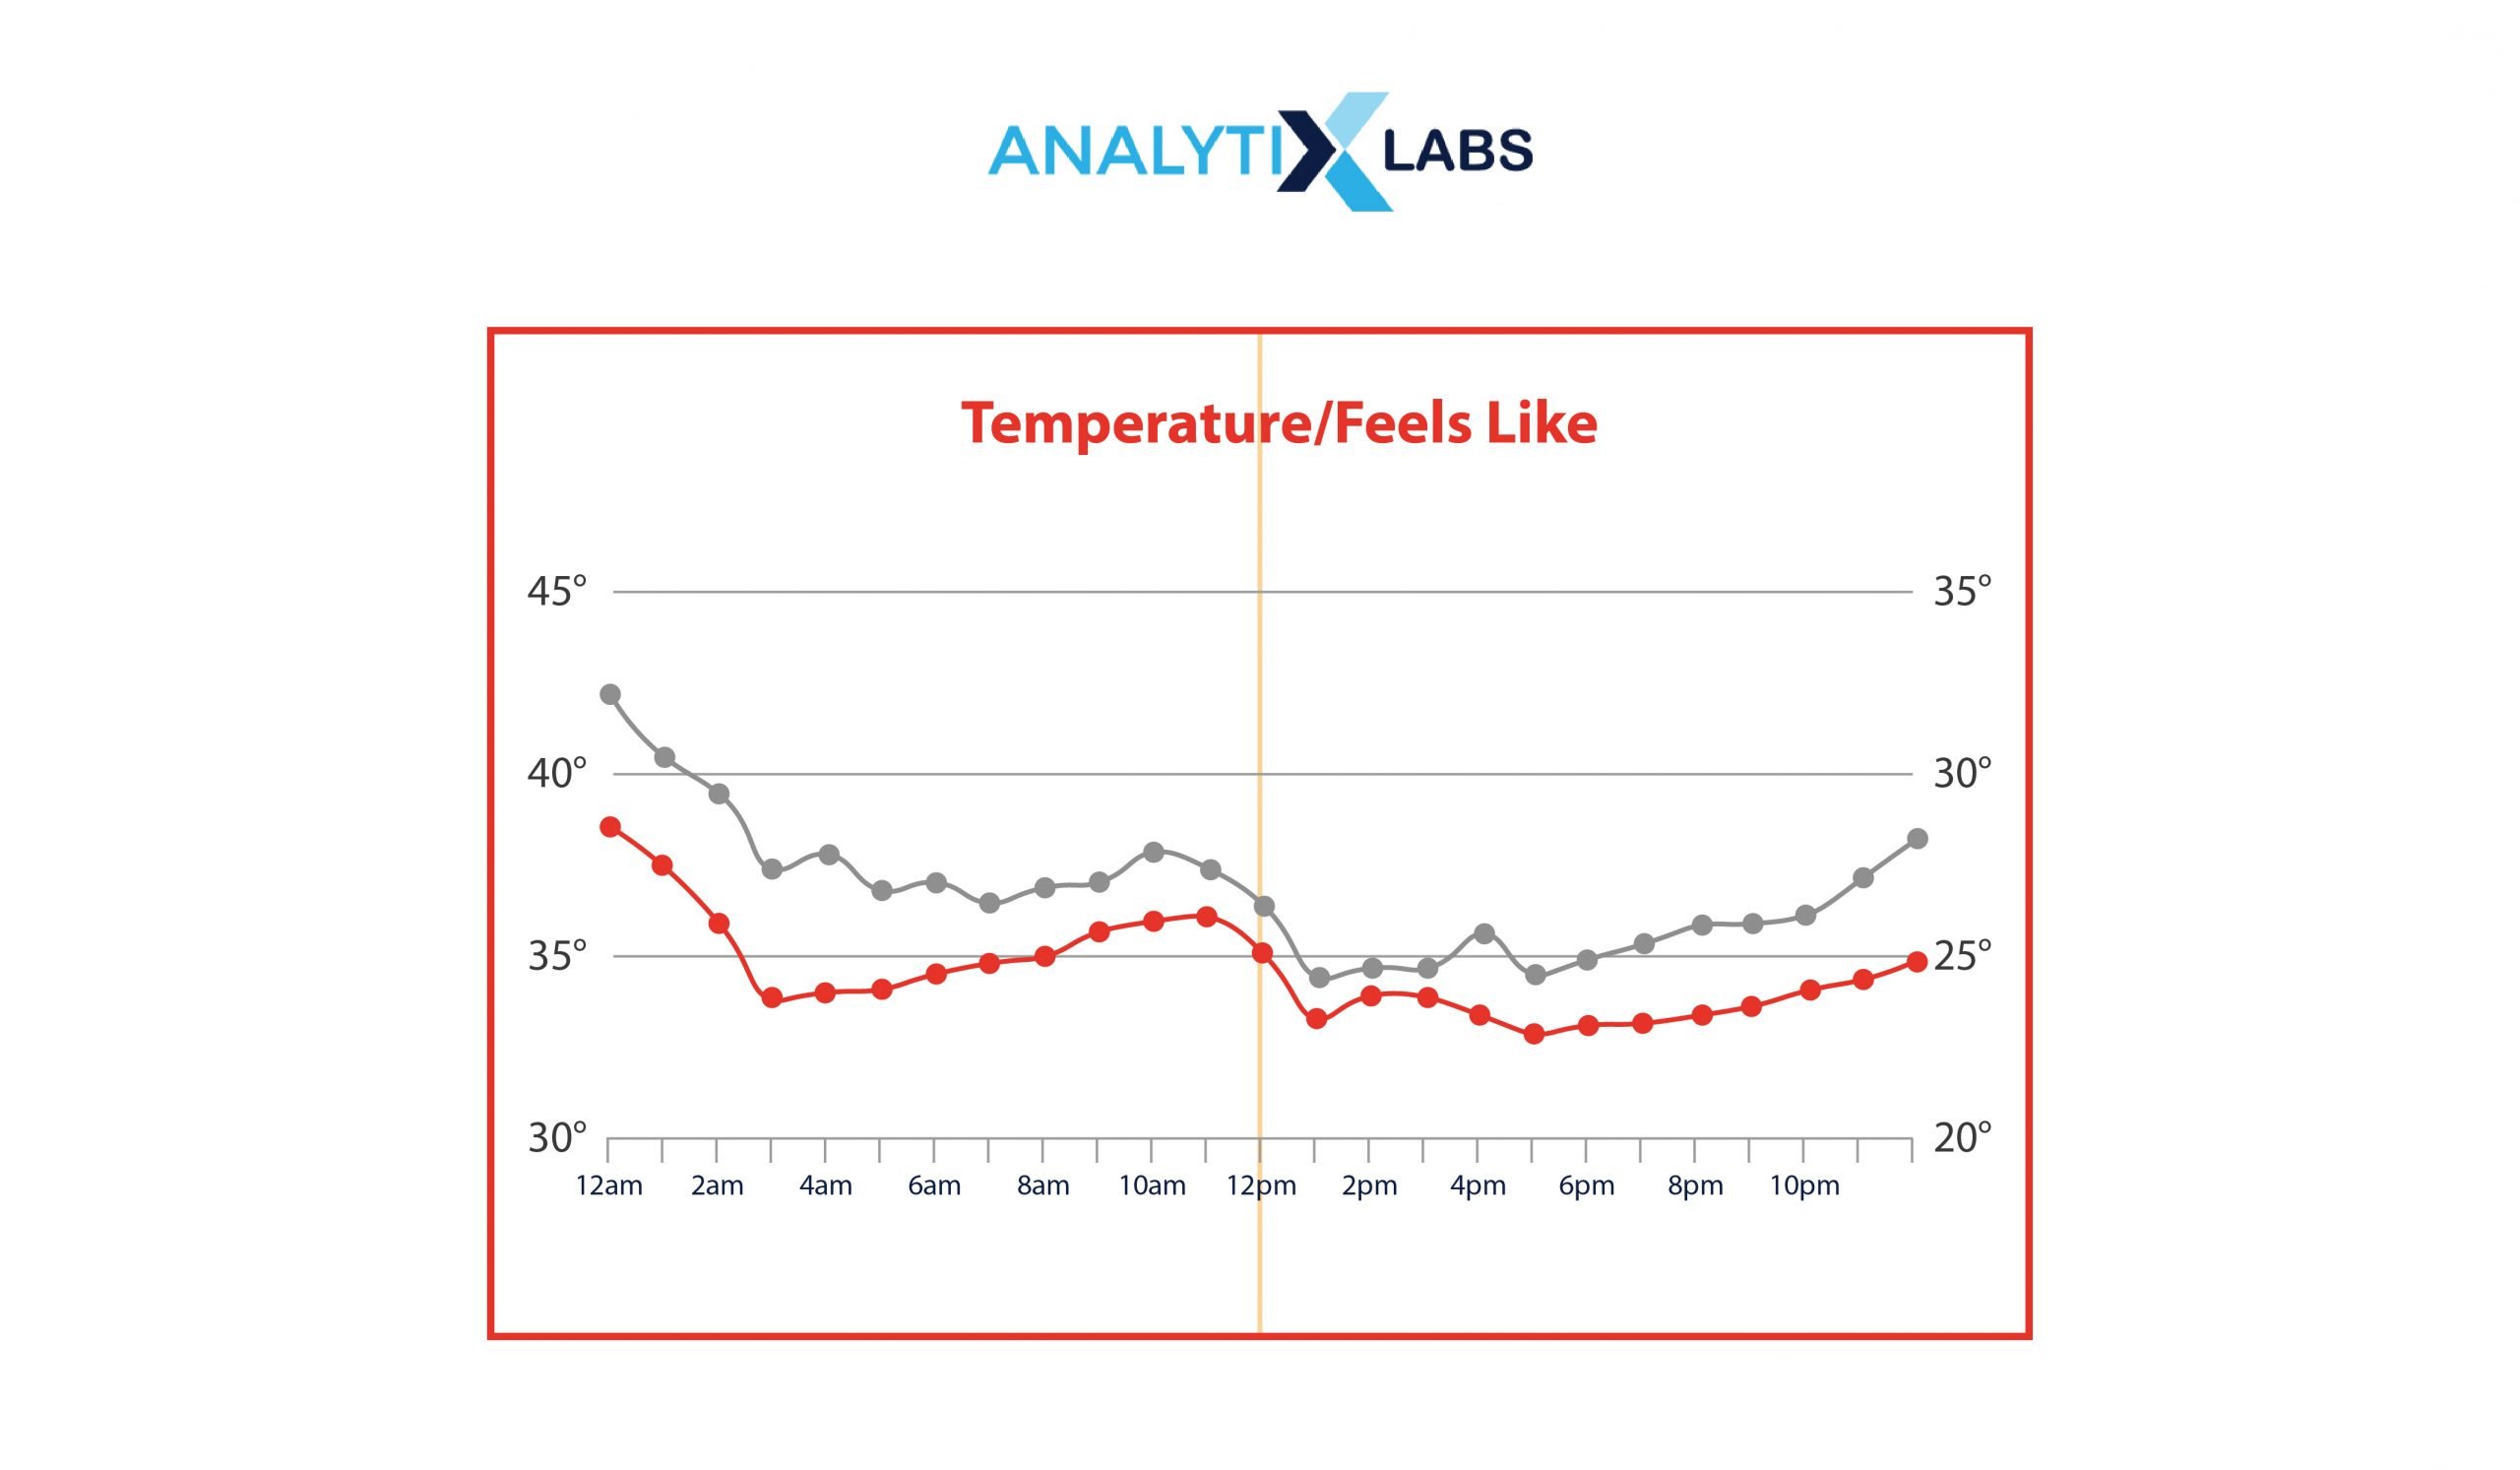
- Weather forecasting time series help in predicting the temperature across the months and predicts seasonal changes. I
- It is frequently employed in the medical field to determine the pulse rate of a patient over time.
Time Series Analysis with Python
Now, that you have understood all about time series analysis don’t you think time is the most critical variable in finding out the growth rate of an event?
Data scientists think so. That’s why the time series method is gaining importance in multiple distinct industries including business, health, and even natural dynamics.
To demonstrate the visible trends within these methods, the Python programming language is being integrated with its smart technical adaptivity.
Time series analysis in Python helps to deploy this algorithm with the Pandas software library and adfuller function.
As seen above, a time series algorithm is a set of observations made at a regular interval of time to predict the future pattern of a particular event.
It does not have more than one variable so it is not like other algorithms such as linear or logistic algorithms in ML supervised learning. The time series algorithm is only dependent on time.
Source: CodeBasics YouTube Channel
There are four major modules of this algorithm that you need to understand to realize how time series is crucial.
1. Stationarity
Stationarity simply means that the statistical parameters of a process are not changing over time, even if there are relative changes in the dataset. Time series data can be best handled by the stationarity approach in multiple cases.
Let’s look at an example to understand the concept of stationarity. If you own a gift shop and you are reviewing the sales. You notice that in January, 115 articles were sold, followed by 125, and 99 in February and March. Now you can say, your sales have stationarity concerning the time series algorithm.
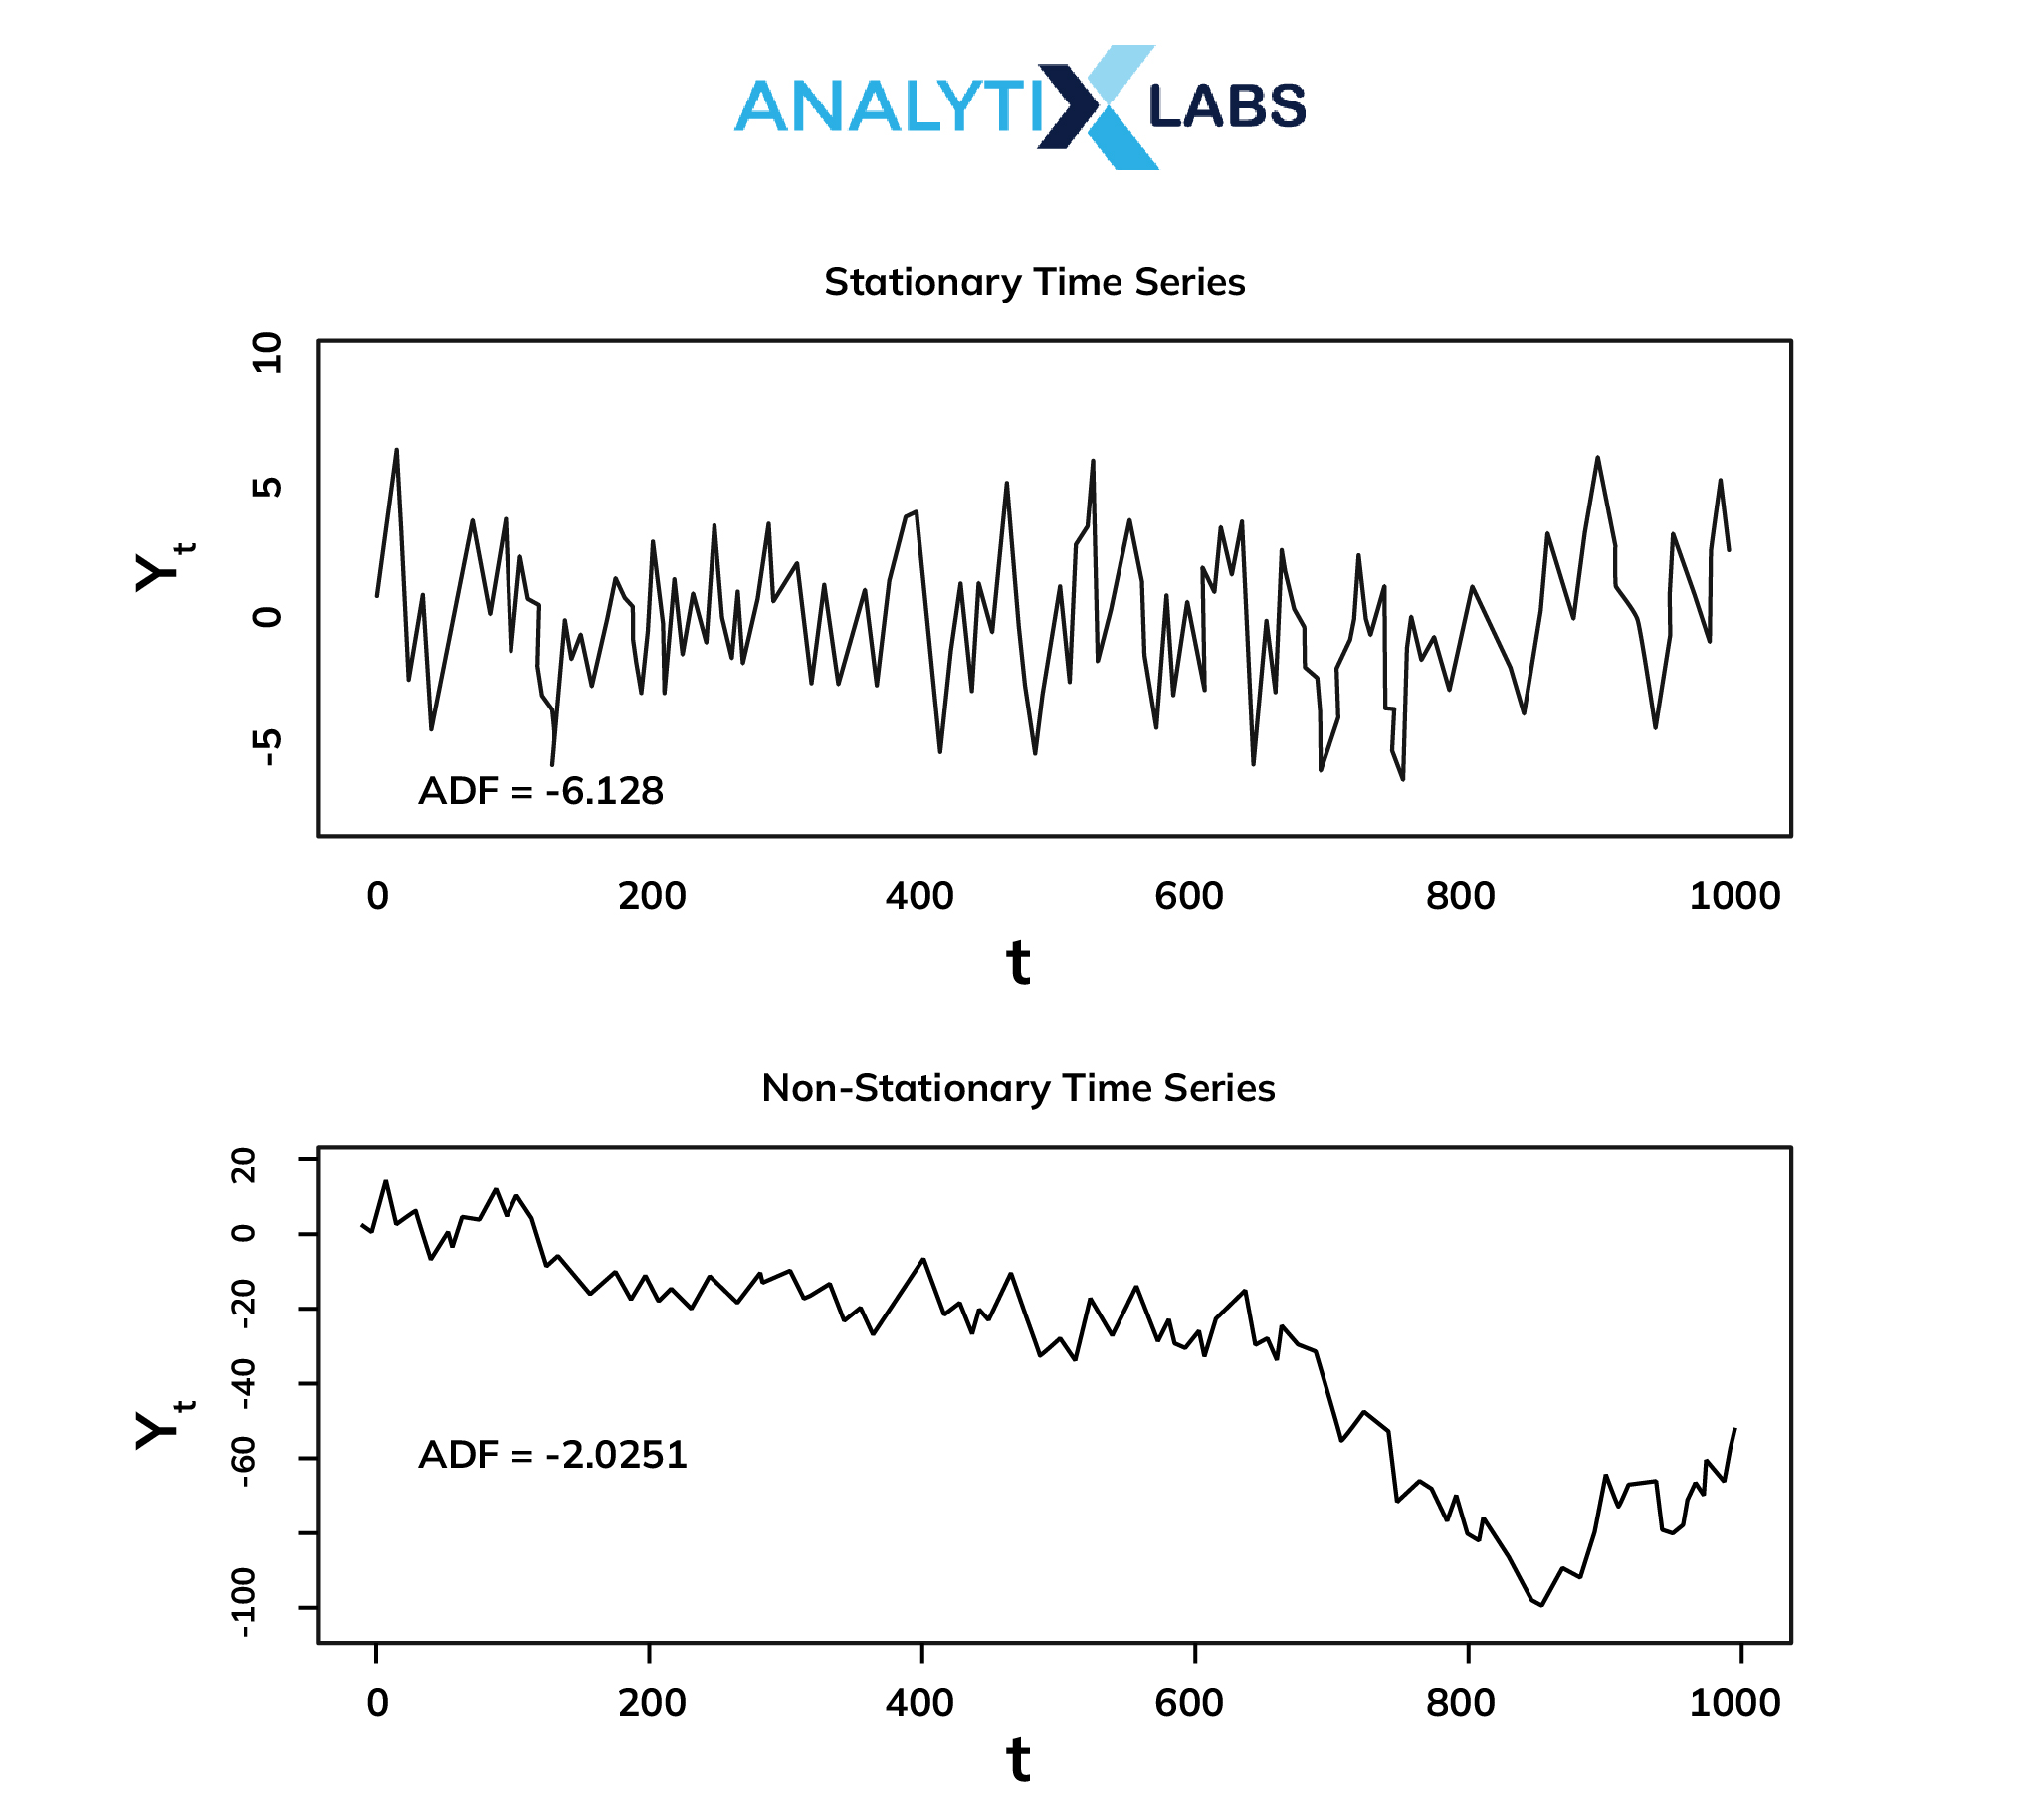
Why is Stationarity Important in Time Series?
- It is easier to analyze a huge dataset and create a simpler model for better usability.
- It has better predictability for different case studies, including trend estimation, forecasting, and causal inference.
2. Autocorrelation
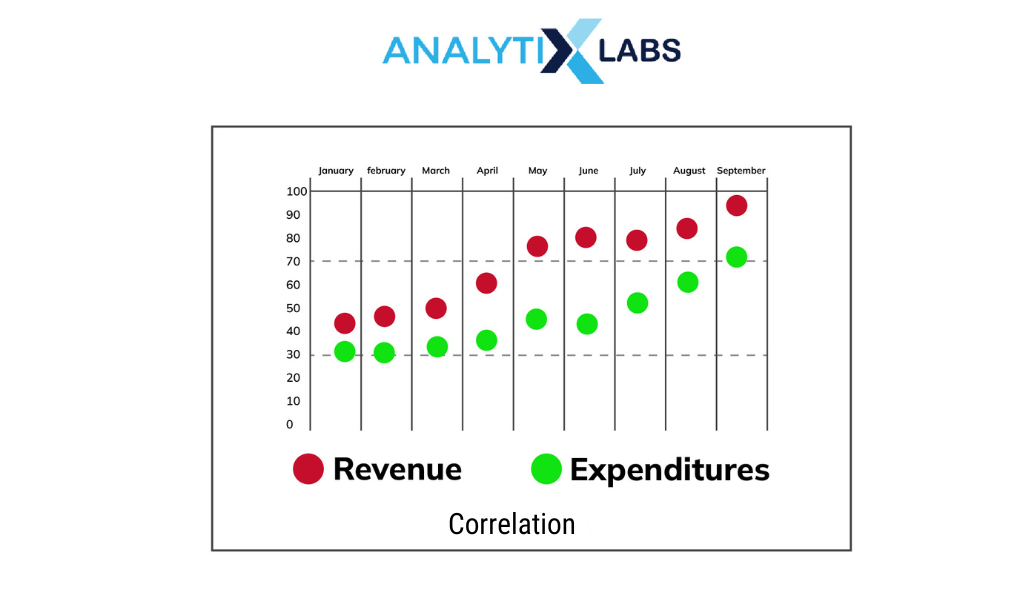
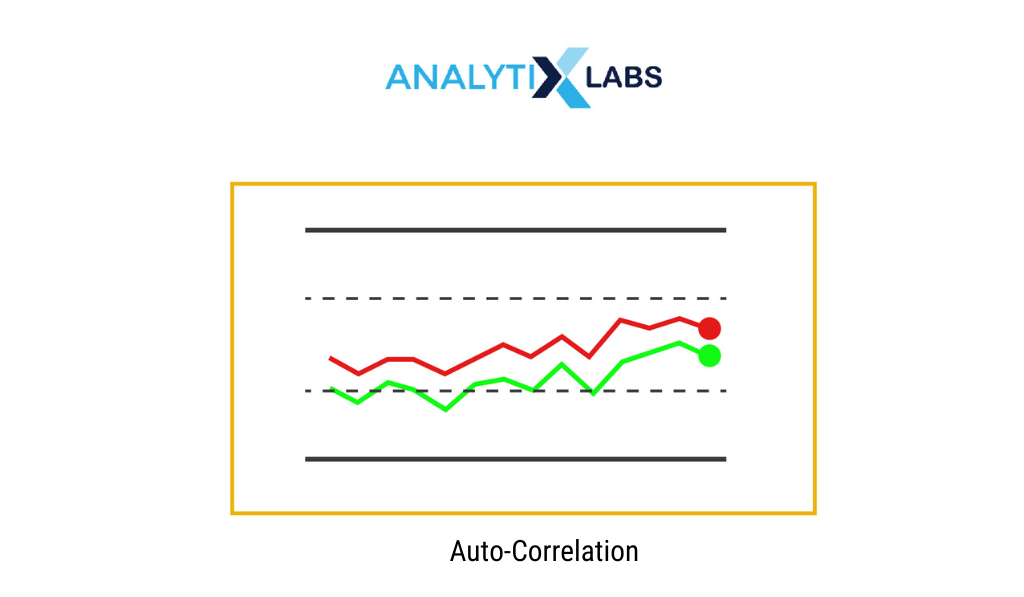
To understand autocorrelation, you need to know what correlation refers to. As the name suggests, correlation is a relative relation between two different variables at the same time. If both values increase with time, it is a positive correlation, otherwise, it is a negative correlation. Similarly, autocorrelation also works with changing data, but the comparison is between past and present trends.
Since past trends can decide the probability of the present scenario, autocorrelation plays a key role in the analysis of the time series algorithm.
Why is Autocorrelation Important in Time Series Data Analysis?
- It is important to analyze the past trend of a given situation to modify the present parameters of a statistical model.
- It gives a strong idea of the given dataset with huge time lags as well.
3. Decomposition
Decomposition in the analysis of time series in statistics is an important part to segregate different categories, trends, seasonality, and noise in the dataset. The catch is to spilt the whole time series into different parts to observe the required trends.
Why is Decomposition Important in Time Series?
- It provides a useful abstract model to process the time series data analysis for a better understanding
- Time series decomposition helps to follow past patterns to make either additive or multiplicative models . The first model would be used when the variations do not vary with the time series whereas the other model is used when the trend is proportional to the level of the time series.
4. Forecasting
As the name suggests, forecasting is one of the key parts of the analysis of time series. All three points mentioned before are the steps to make the right time series forecasting. There is a wide range of applications in data science and in different industries, where time series forecasting is a major part.
Why is Forecasting Important in Time Series?
- Crucial business forecasting like product demand, resource allocation, and financial performance can be predicted thoroughly with this approach.
- This is the resulting step of time series decomposition to offer a conclusion to a problem statement.
How Python is Relevant to Time Series Analysis?
Time Series is a complicated algorithm with huge data, relative parameters, and sensitive business demand, time series analysis in python makes it simpler. The Pandas library is specifically designed for financial sector analysis and related estimations. Also, Python includes time stamps, time deltas, and time periods along with the in-built modules.
Also read: Best Python Libraries for Machine Learning
For example, you can plot the stationarity graph after importing matplotlib.pyplot and seabornlibraries and then using another package, from statsmodels.tsa.stattools import adfuller
Similarly, applying autocorrelation theory becomes easier with the autocorrelation method from the Pandas library only. To apply decomposition, the key line is to import the package from statsmodels.tsa.seasonal import seasonal_decompose.
FAQs
1. What is meant by time series analysis?
Time series analysis is a specific way to observe a particular entity with just one variable, time. The main goal is to analyze a business trend or any natural or global incidents like air pollution to ease decision-making on the matter. The time series machine learning algorithm is all set to study past and present situations based on a regular interval of time to get a futuristic solution.
2. How do you analyze time series data?
A similar kind of data is collected over a while and the final observation or model is presented using different statistical approaches. Data scientists work on time series analysis in python for a comprehensive result.
3. What are the four components of time series analysis?
The time series data can be best handled by the four major components – secular trends, seasonal variations, cyclical fluctuations, and irregular variations.
Secular trends describe the general movement of data to increase or decrease or stagnate over a long period of time. Seasonal variation is the tendency of an event to change in different seasons. For example, in July-August, the tendency to rain increases. Then, cyclical fluctuation is a periodic change in an event without depending on any particular season. Finally, irregular variations include the nonrandom sources of variations in series.
4. What are the types of time series analysis?
The main three types of time series data analysis are moving average, exponential smoothing, and ARIMA (Autoregressive Integrated Moving Average). For a very short-run autocorrelation, the moving average model is used. On the other hand, exponential smoothing is used for immediate forecasting using univariate data. And, ARIMA is one of the most useful models, used in the analysis of time series in statistics.



![Deep Learning Interview Guide: Top 50+ Deep Learning Interview Questions [With Answers]](https://www.analytixlabs.co.in/blog/wp-content/uploads/2021/11/1-8.jpg)
