Almost all companies today generate and maintain data. Technological advancements allow data to be easily stored, transformed, mined and analyzed. As the volume and velocity of data have increased, so has its veracity, which has made ‘data the oil of the 21st century‘.
It is anticipated that 147 zettabytes of global data will be created and consumed by 2024 end.
When analyzed effectively, data is prized for its ability to solve key business problems. This is where we use business analytics, an important discipline of data science. It focuses on providing business solutions. Each discipline has certain tools associated with it, and this is also the case with business analytics.
In this article, you will learn about the prominent business analytics tools that can help you perform business analysis effectively. However, before diving deep into the various tools, let’s understand business analytics in more detail.
What is Business Analytics?
Business analytics is often considered a part of data science that focuses on solving business problems. The methods used in business analytics include data analysis, descriptive and inferential statistics, statistical models, and various other quantitative methods.
An iterative methodological approach explores data and finds insights that aid informed decision-making. The effectiveness of a business analytics initiative depends on multiple factors, such as the quality of data, the analyst’s skills, the type of technique employed, and the tool being used. In this article, we will focus on business analysis tools.
Combining Analytics with Business
Business analytics is a relatively new field, not over 20 years old. This discipline started with using Excel spreadsheets and dashboards to minimize human errors. The discipline was restricted for operational reporting, which caused the data not to be used properly.
The decision support system (DSS) was introduced in the 1970s to enhance the organization’s data flow. It enabled companies to sort, filter, and analyze large amounts of data. Soon, with innovations like Google Analytics, the capability of analyzing data to solve complex business problems was enhanced.
Today, business analytics has moved from mere operational reporting and casual data analytics to automated and predictive analysis, providing insights to businesses that were previously impossible to get. This is why companies today increasingly rely on analytics for business decision-making.
Steps of working on Business Analytics
Business analytics is performed typically in the following manner-
1: Understand the business problem and the goal that the business analytics initiative aims to fulfill.
2: Identify the methodology, techniques, and tools that are to be used for performing analytics.
3: Arrange for the data that will allow the analyst to gain insight. It’s often the case that the data is lying in multiple systems and needs to be collected from various sources.
4: The data must be collated by cleaning, integrating, and combining data into a single dataset.
5: Perform analytics and interpret the outputs to convey business insight. When creating statistical models, they need to be deployed so that scoring can be performed and real-time informed decision-making can happen.
Types of Analytics
Business analytics is a vast field and uses different types of analytical techniques. To understand business analytics, you need to be aware of the types of analytics. The four types of analytics are the following-
#1 Descriptive
It’s the simplest type of analytics, where descriptive statistics are used on historical data to find KPIs, summarize current work, provide factual information, etc.
#2 Diagnostic
While descriptive analytics explains ‘what’ has happened, diagnostic analytics focuses on ‘why something has happened‘ and tries to find the causes. Here, probabilities, likelihoods, and distribution of outcomes are leveraged to understand causal relationships.
#3 Predictive
With Predictive Analytics, we focus on ‘what will happen’. The data is, therefore, used to understand trends and the likelihood of certain outcomes happening in the future. Predictive models are employed in such a type of analytics.
Also read: Understanding Predictive Analytics – Uses, Tools, and Techniques
#4 Prescriptive
The outcome of predictive analytics is used as the basis here. The idea is to find solutions and recommendations to take a course of action to handle the upcoming situations (as indicated by the predictive models). Approaches like recommendation engines, simulations, etc., are used in prescriptive analytics.
Thus, business analytics is a vast field; therefore, it’s no surprise that multiple tools are used in this discipline. Let’s now discuss briefly the importance of business analytics and how it differs from business intelligence solutions, but before that –
Explore our Business Analytics 360 course and join us for experiential learning that will transform your career. Check out our upcoming batches or book a free demo with us. Also, check out our exclusive enrollment offers
Importance of Business Analytics
Business analytics is crucial for any company today. It’s because it serves multiple purposes, such as –
- Comprehending organizational structure and company dynamics.
- Identifying areas of improvement.
- Prepare businesses for future events.
- Recommending solutions to accomplish goals.
- Understanding the present scenario the business is working in will help the company in the future.
- Enable data-driven decision-making rather than relying on unscientific methods, intuitions, and uninformed suggestions.
Business Analytics vs Business Intelligence: Key Differences
A common confusion among those exploring business analytics (BA) is how it differs from business intelligence (BI). While both are types of analytics, they focus on different aspects and aim to solve different problems.
- Business Intelligence solutions provide information about a business’s present situation. In contrast, Business Analytics focuses more on diagnostic, predictive, and prescriptive analytics to generate actionable insights for informed decision-making.
- While BI summarizes data, BA predicts data and prepares the business for upcoming scenarios. However, this doesn’t mean descriptive analytics don’t occur in BA because the present situation must first be understood in order to understand the future.
Still, the focus is more on future events than current ones, which is why BA focuses more on application tools rather than reporting tools.
Also read: Business Intelligence vs. Business Analytics: What Are The Differences?
After understanding business analytics and its various concepts, we will now explore the numerous tools common to it.
Let’s begin by understanding what ‘Business Analytics Tool’ means.
What are Business Analytics Tools?
The application software that allows users to retrieve data from multiple business systems, combine them into a repository, review, analyze, and mine them, and create predictive models are considered business analytics tools.
Any tool ranging from spreadsheets and statistical software packages to data mining and predictive modeling tools are considered part of business analytics tools.
Referring to the above discussion, the tools associated with them can explain the difference between business analytics and business intelligence. While business intelligence tools gather, summarize, and present data, analytics tools go further by providing insights and explaining the underlying reasons behind the data trends. They pinpoint problem areas, anticipate unforeseen situations and forecast outcomes based on potential decisions.
Consequently, business analytics tools are more intricate and advanced, aiding companies in achieving their objectives, maintaining competitiveness, and enhancing customer satisfaction and stakeholder value.
The selection of tools for a business analytics initiative depends on various factors, including data sources, tool compatibility with existing systems, practitioners’ skill levels, and financial resources for acquiring commercial tools.
After this introduction, let’s start discussing the prominent business analytics tools.
Top Business Analytics Tools To Learn
Business analysis tools are crucial for any business to analyze its data and develop actionable insights properly. Each of the tools in business analytics is unique as it performs a particular operation in the business analytics workstream.
Some of the most common and significant business analytics tools are the following –
1. Excel

The most basic yet versatile business analytics tool is MS Excel, which remains prominent after many years. Excel is a spreadsheet developed by Microsoft that is so commonly used that it has become a synonym for spreadsheets.
Its popularity is due to its accessibility, low cost, easy learning curve, and a plethora of documentation on its functionalities. It has features like PivotTable, form creation, What-If analysis, VBA, etc., making it a highly powerful tool. The limitation, however, is that it’s relatively difficult to work on Excel when dealing with large datasets.
2. SAS
SASInc. developed Statistical Analysis Software (SAS), a commercial suite capable of performing data mining, statistical tests, and predictive modeling. Large organizations, such as prominent financial institutions, adopted SAS as one of the earliest statistical software solutions at scale.
SAS’s biggest advantages are its versatility, robustness, simple learning curve, security, and support. Today, it competes effectively as it has also integrated ML and AI functionalities. Large organizations dealing with complex tasks commonly utilize it because of dedicated modules for anti-money laundering, IoT, forecasting, text analytics, and more. Its biggest disadvantage is its cost, which makes it out of reach for small to mid-size companies.
Also read: How to learn SAS : Certification, Skills, and Opportunities
3. Microsoft Power BI

Microsoft provides various business analytics tools, among which Microsoft Power BI stands out. Beyond mere reporting, Power BI empowers users to craft interactive reports, delve into data preparation, discover insights in real time, and generate comprehensive reports.
Its cloud-based functionality enables access from anywhere, enhancing its usability. Although Power BI’s scope in the business analytics domain may have some limitations, it efficiently fulfills its intended functions, making it a valuable asset in the analytics toolkit.
4. Tableau
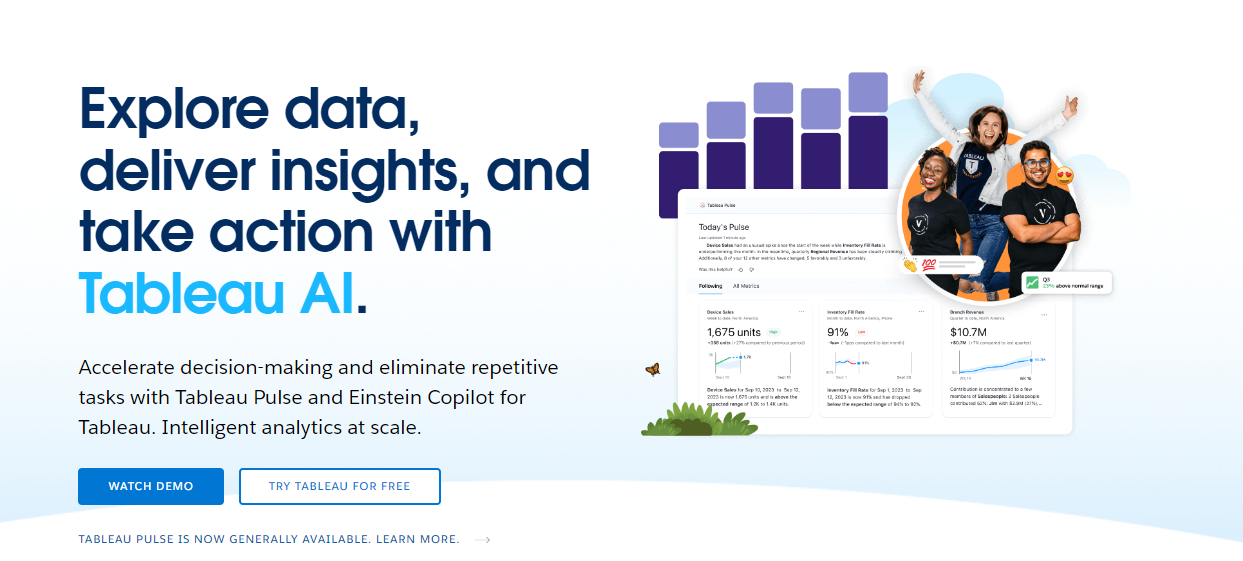
Another business analytics tool similar to Power BI is Tableau. It allows for data visualization and dashboards by connecting to data sources. It also has the capability for data discovery and cleaning, making it an easy and robust tool. Tableau is often used to predict patterns in data.
5. Qlik Sense
Qlik Sense is a next-generation cloud-based analytical tool. Apart from creating the usual charts and interactive dashboards, it uses sophisticated machine learning and artificial intelligence algorithms for data mining and processing. Its analytics capabilities encompass all types of users and clouds (including private, public, and hybrid clouds).
6. Splunk

Splunk Technology, based out of San Francisco, launched the first version of Splunk in 2004. This business analytics solution has succeeded in processing machine log file data stored in a system and is used to index, search, and find correlations among such files.
It exclusively uses indexes to store data, eliminating the need for a database, which is its biggest advantage. It’s commonly used in small—to medium-scale industries to generate graphs, dashboards, and reports.
7. MicroStrategy
MicroStrategy is considered one of the top business intelligence and analytic tools. It is capable of data discovery, visualization, and web services. Users can create and share reports from any device.
One of the biggest advantages of this tool is its ability to deal with unstructured text data and its reasonable learning curve. Basic knowledge of programming, SQL, and data analysis is required to work with it. MicroStrategy users can also perform third-party mining and real-time forecasting.
8. Sisense
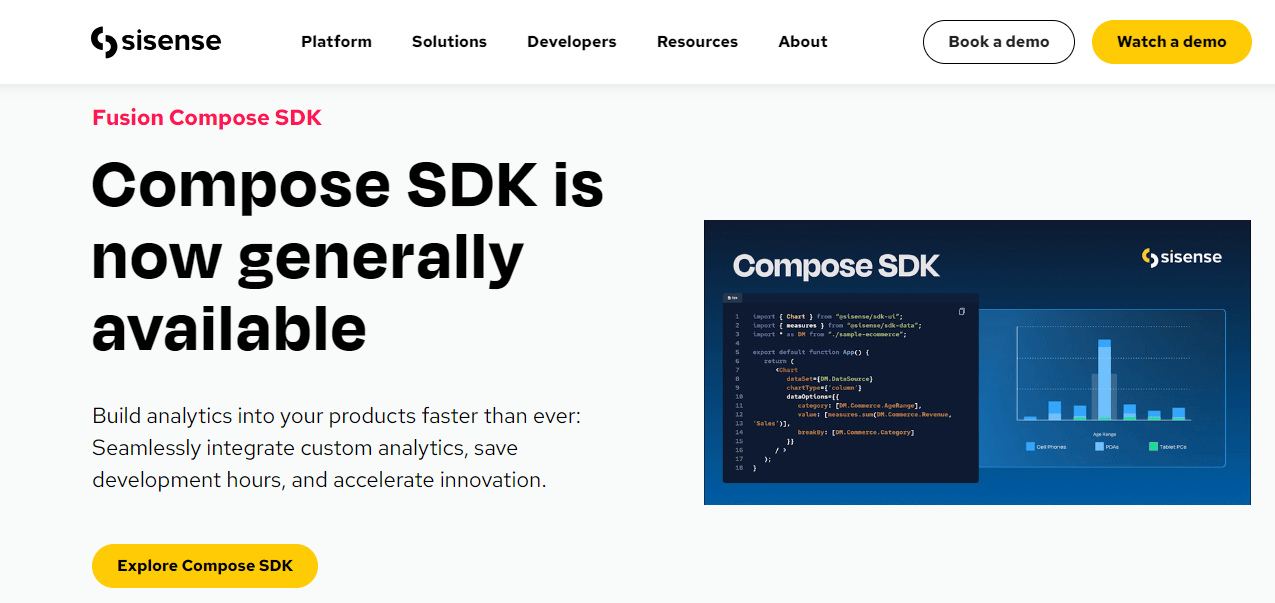
Sisense is used to deal with large and complex data. Of the many enterprise analytics tools, it’s considered among the leading ones. It allows users to perform analysis and visualization on such datasets.
Due to its capabilities, all companies use it extensively, from small to enterprise level. According to industry experts like Gartner and Dresner, Sisense is increasingly considered the leading cloud analytics platform. This is because this tool can forecast future trends and make data-driven decisions by combining data from various sources.
9. Board

Board emerges as a formidable competitor to platforms like Sisense and MicroStrategy, offering custom, intuitive dashboards with interactive capabilities. Its strength lies in effectively handling vast volumes of big data, a necessity in today’s analytics landscape.
With many data manipulation and visualization features like drill-through and drill-down, Board facilitates precise data analysis and forecasting. This robust functionality positions Board as a powerful tool for businesses navigating the complexities of data management and analysis.
10. Domo
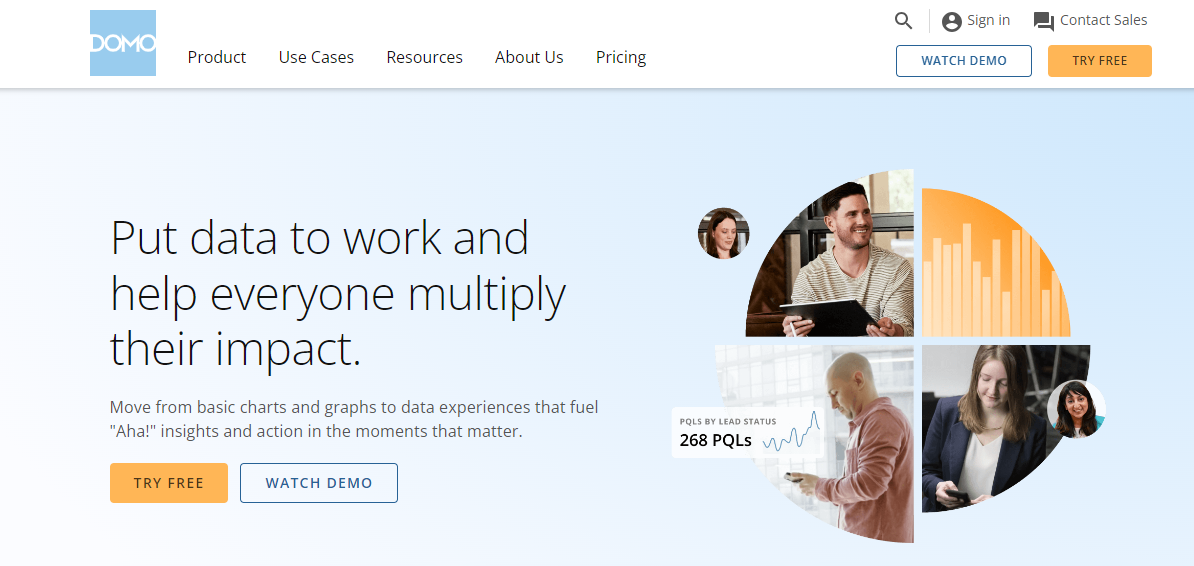
Domo is another business analytics platform based on the cloud that provides data integration and wide connector support. It allows users to see real-time data by offering macro and micro-level visibility. Just like Sisense, Domo is also used by small companies.
11. KNIME
Considered one of the best high-performance tools, KNIME has been developed by expert software engineers. These engineers from the University of Konstanz created a unique data pipelining approach that facilitates varied components for performing machine learning. KNIME can create business analytics reports, perform visual programming, and seamlessly support persistent analysis.
12. Dundas BI

This tool uses R programming to provide top-notch BI and BA solutions. It can perform the usual operations such as trend forecasting, automated analytics, and visualization through high-level dashboards. Users can easily create reports using drag-and-drop features.
13. TIBCO Spotfire
TIBCO Spotfire has numerous capabilities, ranging from performing statistical analysis to analyzing unstructured text data. Its capabilities make it the most advanced business analytics tool. It’s particularly attractive because users can define a time span to create business analytics reports and run analysis, allowing the tool to provide automated solutions.
14. RapidMiner
Complex analytics can be performed using this data science platform. Its biggest advantage is its drag-and-drop functionalities and the fact that it requires no coding knowledge from its users.
While one can import their datasets, it allows users to connect to databases and perform predictive analytics using all sorts of algorithms, from naïve Bayes and decision trees to deep learning and SVM. It, therefore, is a highly time-effective tool if predictive analytics is required to be performed.
Also read: Learning about Algorithm – Definition, Types, Characteristics, Applications, and more
The software for business analytics discussed so far is not open source, meaning it is relatively expensive to run and has less flexibility. On the other hand, open-source tools are free to use and developer-friendly. Therefore, let’s now discuss the open-source tools that can be used for performing business analytics.
Popular Open Source Analytics Tools To Learn
There are several open-source business analytics software and tools out there that can perform various business analytical operations. A few of the popular tools are the following-
15. R

R is an open-source programming language often associated with the quote, “statistical language made by the statisticians for the statisticians”. While specializing in statistical computing, R has great visualization, data mining, and predictive modeling capabilities, making it a great tool for performing various business analytics operations. Given its vast community, libraries, and documentation, it’s a powerful tool you must be aware of and learn if possible.
Also read: Benefits of Learning R Programming Language
16. Python

Python has emerged as a versatile language for analytical tasks thanks to its rich ecosystem of libraries. Modules like Pandas, Numpy, and Scikit-Learn have propelled Python to unprecedented popularity in the realm of data science, solidifying its position as a go-to tool for business analytics.
With Python, users can tackle many tasks, including data mining, visualization, reporting, predictive modeling, machine learning, and AI. Its flexibility and extensive library support make Python an indispensable asset for businesses seeking robust analytical capabilities.
Also read: Why Use Python For Data Analysis?
17. Apache Spark
To perform large-scale data analysis, one needs to deal with big data. This is where Apache Spark comes in handy. It’s a highly flexible and versatile data processing engine that can perform big data analytics seamlessly with numerous platforms like Hadoop, Kubernetes, Kafka, Apache Mesos, etc. Today, Spark is commonly used for enterprise-scale analytics, allowing for real-time data streaming, machine learning, etc.
Also read: Spark for Data Science
18. PIG
PIG allows for analyzing large datasets by manipulating Hadoop data. It has multiple functions, like filters and joins, that allow users to deal with data easily.
19. HIVE

HIVE is a data warehouse built on top of Hadoop that employs an SQL-like interface to process structured data. These tools prove invaluable for businesses requiring extensive analytics, particularly when dealing with big data.
20. Metabase

While typically considered a BI tool, we use Metabase during business analytics operations, especially when we need to visualize the complete data and perform data analysis without writing code. It requires the user to know SQL to perform analysis and allows for creating automated reports and interactive dashboards.
21. Grafana

Grafana is used to perform data observation. It provides a variety of graphs, charts, and alerts and allows users to connect to numerous online data sources. It’s mainly used for real-time data monitoring and analysis.
22. Redash

It is another powerful open-source tool that connects multiple data sources and visualizes data. The user needs knowledge of SQL to use this tool.
23. Apache Superset
Another tool commonly associated with business intelligence operations is Apache Superset. It’s ideal when dealing with large and sensitive data as it has extensive permission systems. It is, however, difficult for non-technical users to use.
If, after exploring various business analysis tools, you’ve developed an interest in this field and wish to pursue a career in it, let’s delve into the steps for building a career in business analytics.
Guide to Career in Business Analytics
Business Analytics is an exciting and lucrative field. Business analysts earn salaries ranging from 6 to 9 LPA; a senior business analyst’s average salary is 12 LPA. To learn more about a career in business analytics, let’s explore its various aspects, such as common job roles, skill requirements, and a roadmap to get you started.
Top Job Roles in Business Analytics
Given that business analytics is an expansive field, it’s no surprise that there are multiple job roles. While some job roles emphasize the descriptive analytics aspect, others focus on the predictive and prescriptive aspects of business analytics. A few of the common job roles associated with business analytics are the following-
- Business Analyst
- Data Analyst
- HR Analyst
- Financial Analyst
- Supply Chain Analyst
- Marketing Analyst
- Data Scientist
- Data Architect
- Chief Data Officer
Soft and Technical Skills You Must Know
To enter the field of business analytics, one must have numerous skills, which can be divided into technical and soft skills.
-
Technical Skills
Regarding technical skills, you need to know a few of the various software for business analytics discussed so far. You also need to know programming, specifically languages like R or Python.
Knowledge of SQL, as you would have noticed from the discussion on tools, is an important skill to have as many enterprise analytics tools work using SQL. In addition, you need to know about various statistical concepts and learn statistical software. Lastly, knowledge of charts and graphs and their appropriate use is also crucial.
-
Soft Skills
Regarding soft skills, you need to be a problem solver, as business analytics aims to analyze data and uncover actionable insights. In this field, you need to develop critical thinking. Moreover, you must utilize business acumen and communication skills to transform data analysis output into actionable strategies and plans and to convey their viability to the leadership.
Business Analytics: Career Roadmap
To get into business analytics, you need to have a plan. A simple roadmap involves following these four steps.
- Bachelor’s Degree: First, you should have a bachelor’s degree. It’s better if it’s related to IT, data science, or business.
- Advanced Degree: Once you have completed it, it would be better to have an advanced degree, such as an MBA, as it would improve your credentials.
- Certification: To finally narrow down your expertise in business analytics, you must get certified in this field by taking related certification courses.
- Work Experience: Lastly, you must get your foot in the door by getting a job in business analytics and start gaining work experience to pursue higher and more peculiar business analytics-based job roles.
While the information on degrees is readily available, let’s discuss certification in business analytics before concluding.
Conclusion
Business Analytics is a rapidly growing field, with an estimated 23.3 million individuals pursuing careers within it, according to LinkedIn. Market growth projections suggest an anticipated increase of 14.3% by the end of 2026. Hence, awareness of this burgeoning field is essential.
A deep understanding of business analysis tools is paramount in Business Analytics. Alongside statistical proficiency and business acumen, familiarity with various tools is crucial for mastery in this expansive discipline.
FAQs:
- What are business analytics tools?
Business analytics tools are application software that performs data analysis, statistical computing, predictive analytics, etc., to gain insights and make better decisions, allowing companies to increase their productivity, revenue, and efficiency.
- What are the four types of business analytics?
Four types of analytics dictate the four types of business analytics: descriptive, diagnostic, predictive, and prescriptive. When we mention business analytics, we typically focus on the diagnostic, predictive, and prescriptive aspects of analytics. However, others are crucial, too, as predictive analytics cannot happen in isolation.
- What are the three pillars of business analytics?
Most of the analytic tools for business work on three pillars. These three pillars of business analytics are-
- Collecting and processing data
- Summarizing and presenting data
- Acting on findings
We hope this article helped you expand your knowledge of the various business analytics software and understand each tool’s role. If you want to start working in business analytics and upskill yourself, contact us.

