We can evaluate a discipline’s progress by analyzing the advancement of its tools and the ease with which their use has spread within its community. As the domain advances, so do the tools deployed in the field. Data Analytics, or Business Analytics, is the newest and most important discipline revolutionizing modern-day businesses. The various data analysis tools discussed below allow companies to gain tremendous insight from their raw unstructured data. You can work with any tool for analysis from many free and paid tools according to your need.
What is Data Analytics?
Data analytics involves the procedures of examining, transforming, cleaning, and modeling data. It helps in extracting meaningful insights, drawing conclusions, and supporting decision-making. It involves using various tools, techniques, and methodologies to analyze data and uncover patterns, trends, and relationships within the data. Data analytics is applied in diverse fields, including business, social sciences, finance, marketing, healthcare, sports, and more. It helps to gain valuable insights from data and make informed decisions.
Data Analytics allows companies to have-
- A better understanding of what has happened in the past
- What is happening exactly in the present
- What could happen in the future, given certain circumstances
This allows the leadership to come up with a much-informed decision. It was earlier impossible as many decisions were based on the leadership’s experience, intuition, and very little data. Major tactical and strategic decisions are sometimes solely based on analytical results.
With the acceptance of data analytics as a legitimate and essential part of a company’s operations, its use has reached companies where analytics was unheard of. The process of data analytics is reflected directly in the analytics tools. They are now much more advanced, sophisticated, and easy to use.
How do Data analysis tools ease processes?
Data Analysis tools can help tremendously in simplifying the process of extracting useful data in the following ways-
Data Preparation: Tools for data analysis frequently include features for cleaning, converting, and merging data, which makes it simpler to manage sizable and intricate datasets. Compared to manual data preparation, these technologies can automate operations, including data cleansing, validation, and normalization.
Data Visualization: Many data analysis tools can create interactive graphs, charts, and dashboards that are visually appealing to the eye. Data visualization can facilitate quickly detecting trends, patterns, and outliers in the data. This simplifies the understanding and interpretation of complex data.
Statistical Analysis: Data analysis tools frequently have built-in statistical algorithms. This allows users to do various statistical studies without intricate calculations or coding. These technologies can simplify and improve the effectiveness of activities like regression analysis, hypothesis testing, and descriptive statistics.
Automation: Automating repetitive data analysis operations like data extraction, processing, and reporting is made possible by the automation features available in many data analysis systems. Processes for data analysis can be made more effective and trustworthy by automation. It can also save time and lower the chance of errors.
Collaboration: Many data analysis platforms offer capabilities that allow users to work collaboratively on projects. This involves data analysis, exchange of ideas, and collaboration on dashboards and reports. Collaboration tools can speed up teamwork and encourage knowledge exchange, improving the effectiveness and efficiency of data analysis procedures.
Different Types of Data Analytics Tools
Numerous Business Analytics tools have grown immensely in popularity and capabilities, especially in the last few years. All these tools, however, cover a particular aspect of analytics and specialize in it. These different types of tools can be understood from the following table:
| Type | Purpose | Popular Tools | |
|---|---|---|---|
| 1 | Collection and Storage | These tools are often responsible for storing a large amount of data. They help in extracting relevant data in an easy and quick manner | Hadoop, Apache Spark, Apache Hive, Apache Cassandra, Amazon Redshift |
| 2 | Analytics | Several tools allow the user to gain sharp insights from the data. Several APIs allow for specific analytics with relative ease and higher efficiency | KNIME, Rapid Miner, Splunk, TIBCO Spotfire, Qlik, SQL, MS Excel |
| 3 | Reporting & Visualization | One of the most important analytics aspects is to present often complex information in easy to understand format. This is where the reporting aspect of analytics comes into play. Various tools help in creating reports and support, especially in the visualization aspect, by easing up the process of creating complicated graphs | Tableau, MS Excel, Power BI, Chartio, Redash, Google Data Studio |
| 4 | Modeling | The backbone of advanced analytics is predictive modeling. Specific statistical and programming tools allow users to create such models using libraries. They help in developing complex statistical, machine learning, and deep learning-based models | Python, R, SAS |
All these tools are considered highly relevant in the industry and used in one or the other analytics processes. However, data analytics tools can be further divided into 2 categories based on the type of their availability, as some are commercially available while others are open source.
| Differences | Commercial | Open Source |
|---|---|---|
| Cost | Such tools are expensive and require a license for commercial use. | Open Source tools are free, and paying for their commercial use is not obligatory. |
| Extendability | New functionalities cannot be added as the source code is not available. | The source code is available, which can be modified to add and increase the tool’s capabilities. |
| Support | The creators of such tools provide professional Assistance for troubleshooting, tutorials, etc. | The online and in-person community provides help for solving problems faced during the use of such tools |
| Adoption | Large multinational companies often use such tools. Especially those working in the field of BFSI (Banking, Financial Services, and Insurance) | Open Source tools are often used by startups, mid-level, and large companies. They are much less expensive and often are at par in terms of capabilities when compared with a commercial tool |
| Examples | 1. Tableau (used by Citibank, Dell, and Barclays) 2. SAS (used by HDFC, HSBC, Citibank, Netflix, Accenture, and Google) 3. Microsoft Excel (used by everyone) | 1. Python (used by Cognizant, Google, Genpact, and Facebook) 2. R (used by Google, Facebook, and Fractal Analytics) 3. Apache Spark (used by Wipro, Ola, and Infosys) |
List of free data analysis tools online
There are hundreds of free data analysis tools online to help you do the online data analysis. They can help in solving the above-mentioned aspects. The tools that can be easily considered the most important are the following:
The first three tools discussed below are those used for high-level analytics involving the development of diagnostic analytics, predictive and machine learning models, etc., and are also rivals of each other. These are Python vs. R vs. SAS.
-
Python
 Source: https://devblogs.microsoft.com
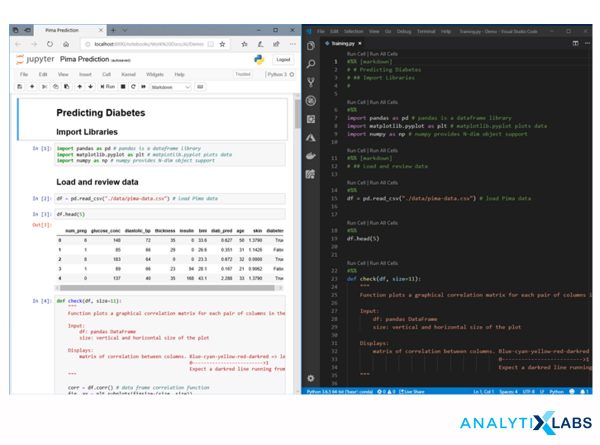
Python is an open-source, high-level scripting language developed by Guido Van Rossem in 1991. It is recently considered a data analysis tool because of the wide range of libraries the Python user community has evolved over the last few years, allowing it to compete with traditional data and business analytics tools. The following are the important features of this tool:
- Easy learning curve and can be quickly learned by those new to the programming world.
- It is an open-source and object-oriented language that allows users to add new functionalities making the tool extremely versatile.
- Python can work with many IDE (Integrated Development Environment) and notebooks, especially Jupyter Notebook, making storing, debugging, and reusing code extremely easy.
- It is considered one of the fastest languages; however, it requires much RAM to work efficiently.
- Python can work well with Big Data platforms and has data mining, manipulation, and model-building capabilities. Packages such as pandas, scipy, and NumPy allow this tool to perform data-wrangling tasks. In contrast, sci-kit learn, Keras, and TensorFlow provides the much-needed capability to develop machine learning and deep learning algorithm-based predictive models. Other packages include stats and statsmodels that help this tool to perform statistical functions and create statistical models.
- A primarily advanced tool for modeling, python can be used for reporting and visualization with its packages such as matplotlib, seaborn, Altair, etc., helping automatically generate reports.
You may also like to read: 10 Steps to Mastering Python for Data Science | For Beginners
-
R
 Source: https://www.fiverr.com
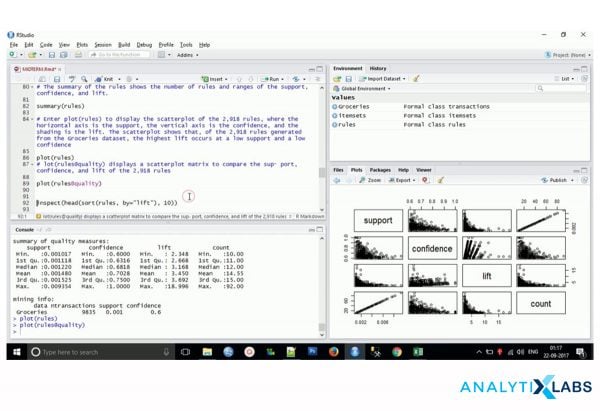
R is known as the statistical language made by the statisticians for the statisticians. Like Python, R also requires a bit of coding and programming capabilities from the user for it to function. Developed by Ross Ihaka and Robert Gentleman in 1995 (released in 1997), R is an open-source statistical language that primarily found its place in the world of academia and research and was later adopted by the BFSI companies. Following are the primary features of R-
- R has a bit of a steep learning curve (if compared to Python). However, once mastered, R provides many capabilities that justify the effort to learn it.
- As R is an open-source language, it has a powerful community with CRAN acting as the quality control organ for this community providing good quality, high capability libraries that cover data analytics needs of almost all domains, from medical to insurance.
- R is commonly used with R studio as the preferred IDE. R Studio can easily customize the layout and has the right code debugging capabilities. It even allows for the objects of this object-oriented language to be saved in the physical memory for further use. This makes R Studio a much more user-friendly IDE, making the task of code reusability much easy.
- R’s biggest accomplishment is its sound statistical capabilities, allowing for its widely accepted use in universities and government organizations. Unlike the statistical packages of Python, R has statistical packages that have been developed by CRAN (or, in other words: by the developers of R) and not by some third party, which makes the results of the statistical tests computed from R much more reliable. The libraries such as caret and h20.ai provide machine learning and deep learning capabilities, whereas dplyr and reshape allow data manipulation easily in R.
- Reporting and Visualization are one of the best features of R as it has significantly advanced and sophisticated libraries such as ggplot and plotly that can create beautiful and complicated graphs. Also, R allows the user to easily create dashboards using R shiny, making it a one of its kind tool with a simple learning curve.
-
MYSQL
 Source: https://codingsight.com/10-best-mysql-gui-tools/
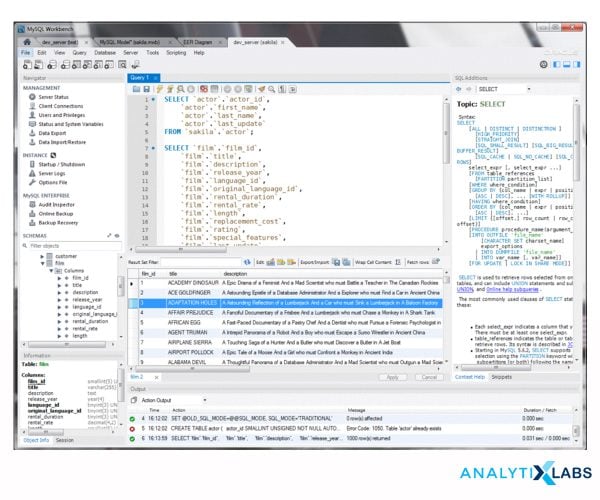
MYSQL is a query-based language that is one of the most commonly used languages. Before the advent of SAS, R, and Python, the most common tools used for any analytics were SPSS and SQL. Today, SPSS sees minimal use. However, SQL has successfully transitioned and adjusted itself to the modern-day requirements of Big Data. It is for the following reason that MYSQL has continued to be in widespread use-
- MYSQL can easily be connected with various software, which makes it a very attractive DBMS (Database management system). The recent version of MYSQL provides high data security and support, making a range of companies adopt it.
- The most significant advantage of SQL is the extremely easy learning curve as a large population of analysts is familiar with it, as the SQL queries are mostly in almost plain English.
- SQL has survived the wrath of time because of its speed, and it is a high-performance tool that allows for the processing of a tremendous amount of queries which is why many E-commerce companies prefer to use MYSQL.
- MYSQL falls in a unique place as, technically, it is a free, open-source tool making it inexpensive with the security of proprietary software, allowing for a wide range of companies, from startups to big multinationals, to opt for it.
-
Microsoft Excel
 Source: https://www.techonthenet.com/excel/charts/line_chart2007.php
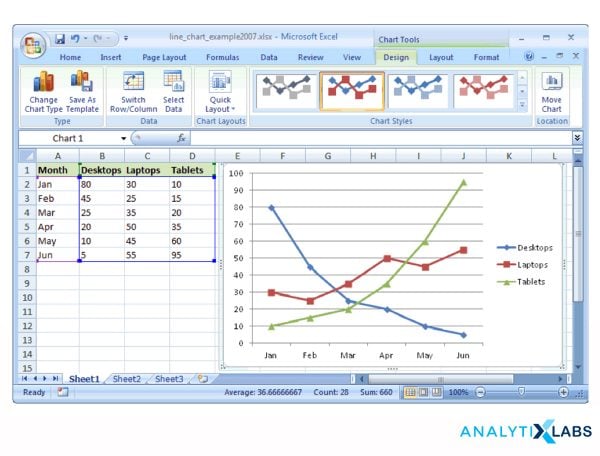
Often ignored and not taken as a serious tool for performing data analytics is MS Excel. The main reason that some data analysts do not consider Excel an important enough tool is mainly because of its limitation in dealing with large amounts of data. However, one must know that not always there is a need to deal with a large amount of data.
Often after passing the data through other tools for microanalysis, MS Excel is the greatest tool. It’s a preferred tool for a preliminary inspection of a sample or a subset of a large dataset. The ease with which Excel can perform typical day-to-day business analytics tasks is why almost all companies on the face of Earth deploy it.
It is expected from all the analysts that they know at least the basics of it. It is for the following reasons that MS Excel is so famous and a widely accepted tool:
- Excel has a straightforward learning curve. Because of its graphical user interface, it becomes easy to connect with the datasets, which is highly important, especially for those new to dealing with structured data.
- Excel is a commercial tool that provides great assistance and detailed material regarding using the various Excel formulas that allow users to perform complex analytical procedures.
- Excel can connect to other DBMS, especially SQL servers, and with certain plugins, the user can perform data manipulation on even large amounts of data. When combined with these capabilities, the GUI environment makes it a unique and preferred tool for data cleaning and basic aggregation.
- One of the less-discussed advantages of Excel is its wide range of plugins, which can dramatically increase its capabilities. These tools are often domain-specific and are of superior quality as they are screened through Microsoft.
- The wide reach of Microsoft Excel has led to the creation of a highly vibrant and supportive community, as methods for solving specific problems in Excel can be easily found through Excel’s online community.
- Lastly, a decent enough aspect of Excel is its visualization capabilities. Most of the typical graphs and a few advanced ones can be created in Excel. This is why many companies often use Excel’s simple graphs to visualize their analysis after cleaning and aggregating the data.
-
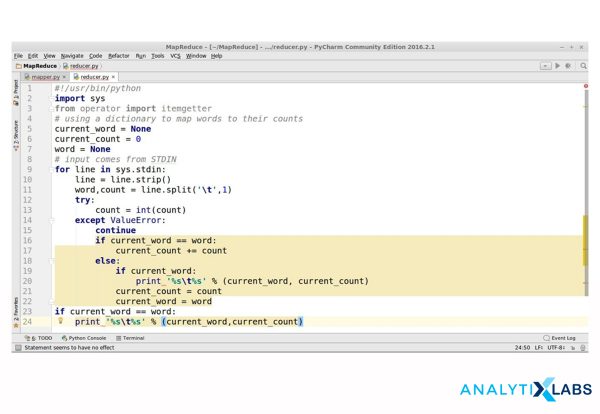
Apache Hadoop
 Source: https://hadoop.apache.org/
With the advent of the internet and higher computer processing capability, the amount of data being generated has skyrocketed. To handle this large amount of data, commonly known as Big Data, some tools have been developed that allow for dealing with the ever-increasing Variety, Volume, and Velocity of data, and among them is Hadoop. Hadoop works on MapReduce technology, allowing users to access and process large amounts of structured and unstructured data. Being an open-source tool, it has wide acceptance. It is a highly efficient and cost-effective tool to deal with a large amount of data as it can work with a cluster of machines without adding any financial cost to the operations. The following features have led to the widespread acceptance of Hadoop-
- As mentioned above, Hadoop is an open-source platform, making it a desirable option for dealing with big data. The commercial version of it, such as Horton and Cloudera, are available at a reasonable cost that provides troubleshooting support and other assistance.
- The sheer community of Hadoop is one of its impressive feats. Hadoop has a vibrant community of users. Many companies have adopted it as it is in use for a long time.
- Another reason Hadoop is a highly cost-efficient tool is its capability to use community storage, which helps companies reduce their storage expense and allows for the pooling of hardware, further bringing down the cost of maintaining high computational machines for companies.
- Like the other tools mentioned in this article, Hadoop too can pride itself on the ease with which it can integrate with other tools. Hadoop can easily integrate with languages such as Ruby, Groovy, Perl, and Python. It can also change its processing unit from Map Reduce to newer frameworks like Apache Spark.
-
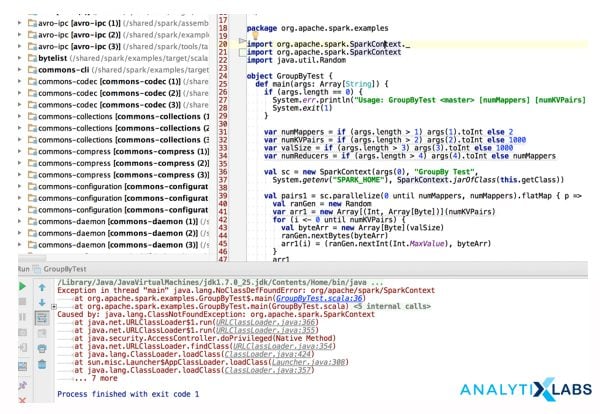
Apache Spark
 Source: https://stackoverflow.com
Apache Spark is one of the competitors of Hadoop. It is a next-generation tool for dealing with large amounts of data. Apache Spark is an open-source data analytics tool with a big data framework. It can integrate with Hadoop making it a desirable option for those analytical firms that deal with a large amount of data. The following reasons have led to the widespread popularity of this tool-
- Data using Apache Spark is processed in real-time. This is particularly advantageous in social media analytics, fraud detection, among others, where the velocity of data is very high.
- Apache Spark has a relatively easy learning curve compared to MapReduce and doesn’t require much coding to function properly. This is why many companies adopt it as they can even train their existing workforce to make them work on Apache Spark.
- Apache can connect with other languages to write code, such as Java, Python, and Scala, making it a versatile tool and accessible to people belonging to different programming backgrounds.
- Apache also allows for numerous algorithms to work with it, especially Machine Learning algorithms and SQL queries, making it not stuck as just another big data framework.
- As it is an open-source tool, it has comprehensive support and a highly informative community, allowing new Apache users to feel confident.
- Lastly, the most significant advantage of Spark is its speed, which is significantly faster than Hadoop because of its RAM-intensive framework. However, this comes at the cost of it becoming a memory-expensive tool.
Both Hadoop and Spark provide a range of options to perform analytics on large amounts of data, but they are different from each other in the following ways:
| Hadoop | Apache Spark |
|---|---|
| Purely a Big Data processing engine that helps perform analytics where a large amount of data is involved. | It can be considered a data analytics engine to deal with big data and support analytics-based algorithms. |
| It stores a large amount of data and shares the machine’s resources. | Apache can deal with real-time data processing, which makes it an attractive option for social media and surveillance entities. |
| It has a steep learning curve and is tough to master | Compared to Hadoop, it is relatively easy to learn and is compatible with Python, Java, SQL, etc. |
| It works on the local drive, which is why it is slower than Apache Spark. | Works on RAM, making it much faster than Hadoop |
List of premium and paid data analysis tools
-
SAS
 Source: https://www.sas.com/en_in/home.html
Statistical Analysis Software, commonly known by its abbreviation SAS, is one of the earliest tools companies adopted once they decided to perform full-time in-house analytics. Unlike the above two mentioned tools (Python and R), SAS is a proprietary tool, which means its source code is unavailable. Its creator can only expand its capabilities- SAS Inc. Like Python and R, SAS also can perform data manipulation, reporting, visualization, and advanced analysis using predictive models using statistical and some machine learning algorithms. As mentioned earlier, SAS has been mainly adopted. It continues to be used by multinational companies involved in the BFSI domains to prioritize customer security over anything else. Also, the cost is not much of a big concern for them. Following are the main features of SAS because which it has stayed relevant-
- SAS has one of the most effortless learning curves, and people with no programming background can quickly learn to use it. Moving from SPSS or SQL to SAS is particularly easy as SAS also has procedural commands, making the switch very convenient.
- Unlike R and Python, SAS has a proper support infrastructure where SAS Inc. provides help in solving problems and training individuals to use various SAS functions.
- Server support makes SAS stand apart from the other tools. Businesses where securing data is of great concern use SAS as a desirable option.
- SAS provides types of licenses with varying capabilities, ranging from simple data manipulation and simple statistical models to advanced predictive models and visualization. However, these functionalities come at a very high cost.
- SAS is relatively slower than Python and R. However, it can easily connect with servers and help with big data operations.
All of the above is summarized in the following table:
| SAS | R | Python |
|---|---|---|
| Commercial Software | Open Source | Open Source |
| Expensive | Free of Cost | Free of Cost |
| Statistical Software | Statistical Programming Language | Scripting Language |
| Can create sophisticated Statistical Models | Can create sophisticated statistical models | Can create decent statistical models |
| No or very less Machine and Deep Learning capabilities | Advanced Machine and Deep Learning capabilities | Advanced Machine Learning and highly advanced Deep Learning capabilities |
| Advanced Server capabilities provided by SAS Inc. | Optional Server Capabilities are provided through R Studio | No Servers are provided (though they can connect to other servers and DBMS) |
| Advanced reporting and visualization capabilities | Advanced reporting and visualization capabilities | Average reporting and visualization capabilities |
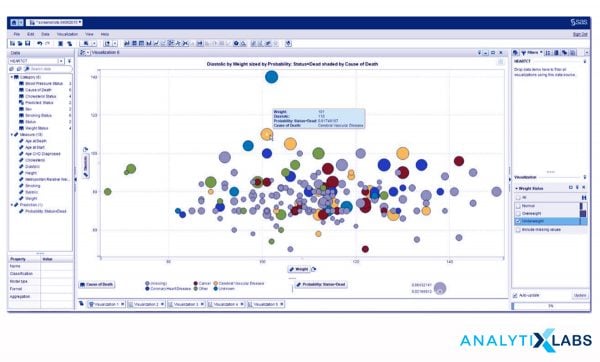
-
Rapid Miner
 Source: https://comparecamp.com/rapidminer-review-pricing-pros-cons-features/
One of the most versatile tools for performing analytics is Rapid Minder. The reason for the sudden success of Rapid Miner is the variety of tasks that it can perform, which range from basic ETL functions to data mining and machine learning. It is one of the rare tools that allows the user to perform advanced forms of data analytics such as Predictive Analytics and Text Mining, using drag-and-drop functionalities. Among the range of advantages that Rapid Miner has, the following are the most crucial ones-
- It can perform almost all aspects of data and business analytics. It is widely used for performing segmentation, data preparations, visualization, and the development of predictive models.
- Rapid Miner’s user interface makes it stand apart from the rest of the tools. People with no programming background can easily work on this tool and efficiently process data and develop insights without putting in much effort.
- Rapid Miner’s capabilities can dramatically increase as it can work with several other tools. Integrating it with R and Python can significantly increase its machine and deep learning capabilities.
- Being an open-source platform, RapidMiner has many libraries that allow it to expand continuously in terms of its capabilities, making it possible to have widespread acceptance from startups to large corporate entities.
- Compared to other open-source tools, RapidMiner has a superior data security system with a robust 4-layer security system making the users confident to use it when dealing with sensitive data.
-
Tableau
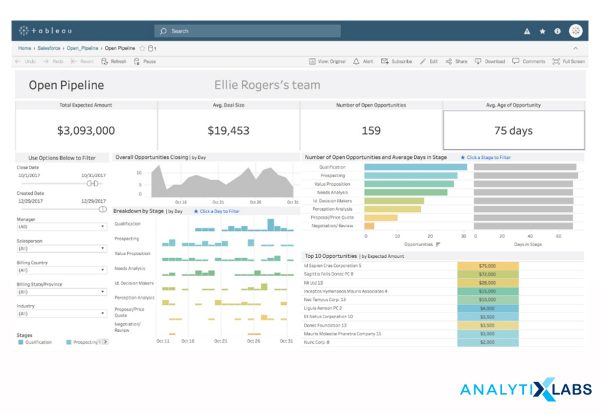 Source: https://www.tableau.com/products/dashboard-starters
While MS Excel can create graphs, and other advanced tools such as SAS, Python, and R can also create sophisticated graphs. However, the place of a dedicated visualization tool cannot be taken by any other tool.
There are several tools for visualizing data, such as D3, Vega, Google Charts, High Charts, etc. in Tableau. Tableau has the disadvantage of lacking support for higher-level SQL queries and cannot deal with enormous amounts of data, but it is still highly popular. We can refer to the following features of Tableau for its widespread use-
- Tableau has the advantage of connecting with various data sources such as a number of DBMS, OLAP, and spreadsheets such as MS Excel. It is especially compatible (especially with the pivot table feature). After a few adjustments, it can also connect with R and Python languages, which take a load of aggregation and other calculations away from Tableau, making it more efficient. This makes it easier for the user to connect regardless of the data storage.
- The biggest advantage of Tableau is the extreme ease with which one can use it as there is no programming pre-requisite, and people with less background in computer sciences can easily learn it. Several times there are dedicated teams for reporting and visualization, knowing Tableau can provide a much-needed credential in a candidate’s profile who is trying to enter the analytics field.
- Continuing the ease of use, the very interface of Tableau allows for quick reporting and the creation of advanced graphs. As Tableau has a graphical user interface, most graphics are created using simple drag-and-drop functionalities, making effortless discoveries of patterns and insights.
- You can use Tableau with Tableau Public, which is free for users. However, it has limited capabilities. The users can also look for the commercial paid version, which has higher capabilities, and the price is also not very high.
-
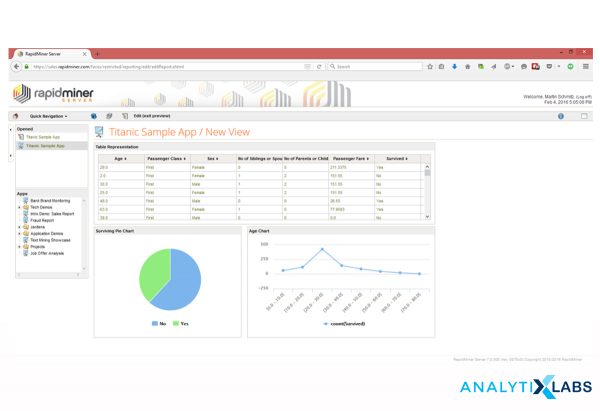
Power BI
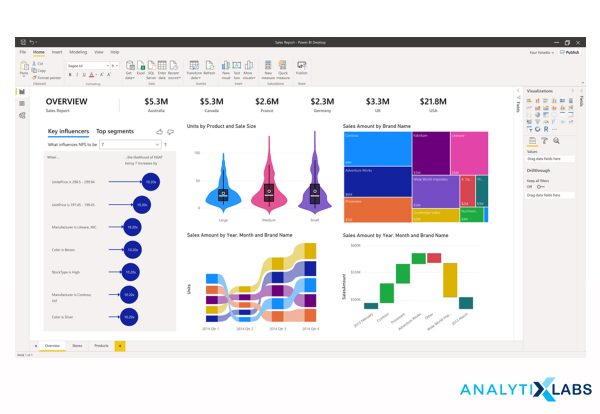 Source: https://powerbi.microsoft.com/en-us/
The success story of Power BI is incredible, as it started as just a plugin for MS Excel. However, it has developed into a separate tool with widespread support and appreciation because of its superior business intelligence capabilities.
Disadvantages of PowerBI include its lack of big data handling capability, difficult learning curve as it is tough to master because of its use of the DAX formula, which is a complicated language to work with, and high complexity because of the sheer number of options that are tough to comprehend. Still, PowerBI continues to see success for the following reasons-
- PowerBI is a highly compatible tool. It can get data from multiple sources, from the typical Excel, XML, and JSON to Databases such as SQL Server, Oracle Database to Azure, and other cloud-based sources. It can also connect to numerous online services, such as Facebook and Google Analytics, making it a highly versatile tool.
- As Power BI is considered to enter a bit late in the world of analytics, it has compensated for this shortcoming by releasing constant updates to its capabilities, making it one of the most up-to-date tools.
- Like Tableau, Power BI has easy methods for performing visualization. It also has drag-and-drop functionalities for understanding and analyzing data quickly and easily. Power BI can also create interactive dashboards and reports and has filters and options for customizing the graphs to accommodate maps, key performance indexes, etc.
- With the recent updates, PowerBI has introduced a few basic concepts of Augmented AI where simple text-based commands can be written in plain English. Power BI provides quick, visually friendly analysis, can be accessed through mobile and other platforms, and can be shared easily.
All the above-mentioned tools allow for quick visualization and help in reporting. However, they have some differences. The following table contains them-
| Excel | Tableau | Power BI |
|---|---|---|
| Commercial Software. Not Free | Free Version available through Tableau Public | Reasonable cost for a free version. |
| Provides Basic Visualization options | Provides Highly advanced visualization options | Provides Highly advanced visualization options |
| Has limited Dashboard capabilities. Tough to update graphs in realtime | Can provide Dashboards and can update graphs in realtime | Can provide Dashboards and can update graphs in realtime |
| You can learn it easily. | Has an intermediate learning curve | It is tough to master and has a relatively steep learning curve. |
Several tools allow us to perform data analytics. However, each one handles some specific aspect of the analytical process. Modeling uses tools like Python, R, and SAS. Reporting is quickly done through MS Excel, Tableau, and Power BI tools.
For performing quick Analytics, tools such as Rapid Miner and MYSQL are particularly of great advantage, while for storing and accessing data, Hadoop and Apache Spark can come in handy. With each one of these tools helping solve various business problems, one must try to know as many of these tools as possible.
You can learn a practical approach from any one of the tools. You can choose Python or R for modeling, Tableau and Power BI for visualization, and Apache or Hadoop for dealing with big data.
Basic things to learn before using these tools
Indeed these data analysis tools are like a boon. But before implementing them, you need to have a basic foundation of a few things, which we have discussed below-
-
Statistical concepts
Learn the fundamentals of statistics, including mean, mode, median, standard deviation, probability, variance, hypothesis testing, and data distributions. Accurate data interpretation and analysis will benefit from your understanding of these principles.
-
Data types and structures
Learn about several forms of data, including category, numerical, and ordinal data. Their representation in many data structures, including spreadsheets, tables, and databases. Learn about several data formats, including CSV, Excel, and SQL.
-
Exploratory data analysis (EDA)
Recognize the value of exploratory data analysis (EDA) in the data analysis process. To get insights and spot trends in the data, learn how to carry out fundamental EDA operations, including data summarization, data profiling, and data visualization.
-
Basic programming concepts
Learn programming fundamentals, including variables, loops, and conditional statements, because some online data analysis tools may need coding. Python, R, and SQL are common programming languages used in data analysis.
-
Domain knowledge
Obtain domain expertise about the area or sector in which you will analyze data. Doing meaningful data readings and reaching pertinent conclusions will be easier if you know the context and domain-specific jargon.
-
Data ethics and privacy
Know the moral and privacy issues when analyzing data, including privacy laws, protection, and confidentiality. Recognize the significance of protecting data security and treating data appropriately.
FAQs
What is the best free data analysis software?
Google Analytics, Zoho Analytics, Qlik Sense, and MS Excel are among the best free data analysis software available online.
How can I analyze data for free?
Many good free online data analysis tools to analyze data for free. Tools like Python, Microsoft Excel, R, Apache Stark and Hadoop, and more. You can work with anyone of them according to your requirements.
What is the best tool for data analytics?
The best tool for analysis varies based on various aspects of your specific use case, requirements, and expertise. Tableau, Power BI, Jupyter Notebook, etc., are some of the best online analysis of data. You can also avail of their paid versions for more features.
(AnalytixLabs provides the most affordable and best-quality courses in Data Analytics. They will help you fit well in AI, ML, and more. You can choose from various courses and get the opportunity to learn from one of the best mentors in the field.)
You may also like to read: 16 Best Big Data Analytics Tools And Their Key Features