

Certified Business Analytics Course
Turn data into decisions. Build job-ready business analytics skills in a short, focused program, online or in the classroom.
315 Hours
4 Months


27 Sept
Noida
25 Oct
Gurgaon
29 Mar
Gurgaon
Learning Modes

Classroom Sessions
INR 41,300/-*
(Pay in Easy Installments)

Interactive Live Online
INR 37,760/-*
(Pay in Easy Installments)

Blended eLearning
INR 33,040/-*
(Pay in Easy Installments)
Courses Included



Artificial Intelligence Engineering
₹ 20000/-
Artificial Intelligence Engineering
₹ 20000/-
Artificial Intelligence Engineering
₹ 20000/-
₹ 65000/-
₹ 48000*/-
Optional Course
Data Science using R
₹ 20,000
₹ 4000/-
Overview

No. of classes X Hours
43 x 3 = 130 hours
+ 10 hours e-learning

Self Study Hours
282 (8-10 hours/ week)
23 hours of Assessment

Placement Readiness Program
8 weeks
(Post Certification)
About Business Analytics Course
The Business Analytics Course helps you master the full workflow of turning data into decisions: querying and preparing data, analyzing it, framing the business problem clearly, and communicating a recommendation people can act on. You will learn SQL, Power BI, Python, Excel, and statistics, framed around real business questions.
Data is at the center of everything we do, and it stands universal now across all domains and industries. The real skill lies in using this data to build decisions that can make or break a company. Start your learning with one of the best business analytics courses in India, and become job-ready in less than a year.
This business data analytics course is short, focussed, and practical in its approach. From hands-on training to solving real problems across assignments and projects, this course has it all along with dedicated placement support to assist you until you succeed.
Why Learn Business Analytics?
Business analytics has evolved to become one of the most dependable career bets in the current data economy. From just a niche specialization, business analytics have come a long way with employment of management analysts (that includes business analysts) growing by 9% by 2034 and over 98,000 openings each year across industries. In India, this growth is even stronger.
NASSCOM reports that demand for data science and AI talent is expected to cross 1 million professionals by 2026 , against a talent base that has historically met only about half of that demand. In short, across banking, e-commerce, healthcare, and technology, companies need more people who can work with data than the market currently supplies, and that gap is what keeps analytics roles well paid and worth training for.
The skills you will learn in this business analytics certification course will map you directly onto roles such as business analyst, data analyst, MIS analyst, and business intelligence analyst, giving you several viable entry points rather than one narrow track. Enroll for the business analytics course with placement without pausing your career for a multi-year commitment and right-away target practical, tool-driven skills that hiring managers are actually seeking in professionals.
What You Will Learn?
By the end of this course in business analytics, you can walk into a room with a messy spreadsheet and walk out with a recommendation that leaders can start acting on. You will learn real skills that are built on the below stack.
- Query and prepare data with SQL: Forget waiting on someone else for the numbers. You can go straight to the database, filter and join what you need, and answer the business question yourself.
- Build dashboards in Power BI: You will learn to design interactive reports that leaders keep open during meetings, not the kind that get built once and forgotten. Tableau is included as a complimentary skill, so you are hireable whichever tool a company runs on.
- Analyze data with Excel and Python: You will know how to clean, explore, and model data using the two tools analysts reach for every day, from a quick pivot in Excel to a repeatable analysis in Python.
- Apply statistics to real decisions: You will know how to use hypothesis testing and the core methods that tell you whether a change is a real signal or just noise, so your recommendations hold up when someone pushes back.
- Frame problems and communicate insights: You can take a vague business question, shape it into an analysis, and present a clear answer in plain language. This is the skill that separates analysts who get promoted from those who stay stuck running reports.
- Use AI assistants to work faster: You will know to bring AI into your everyday querying, coding, and dashboarding, cutting hours off routine work so you spend your time on the thinking that matters.
About Business Analytics Course
Our Business Analytics course will teach you in-demand data mining, analytics reporting, and predictive analytics skills. You will master techniques like statistical analysis, predictive and descriptive modeling, and quantitative analysis.
Simultaneously, with our best online course for business analytics you will learn the concepts of Forecasting, Time Series Analysis, and Econometrics to predict potential results based on historical patterns. This Business Analytics training covers widely used tools like Excel, SQL, and PowerBI and advanced tools like R and Python for Advanced analytics.
The learning objective of this Business Analytics Certification Course is laid down as follows:
- Learn to identify business insights from the data
- Bridge the gap by offering analytical solutions to business problems
- Reflect proficiency in building data models and in handling data analytic tools
- Drive smart business decisions with data-driven solutions
- Effectively communicate technical information and analysis outcomes to people with technical or no technical know-how
- Draw precise estimates of operational, financial, and ethical impacts of a data-driven solution developed in structured or unstructured environments.
Types of Analytics You Will Learn
Business analytics combines past and present data to make futuristic predictions. It offers businesses a direction to proceed that is data-driven. As part of our best online business analytics courses, you acquire knowledge about the four significant types of analytics:
- Descriptive analytics: You learn to describe a business’s past or present position.
- Diagnostic analytics: You learn to analyze and dissect the reasons for past or present situations
- Predictive analytics: You learn to make near-to-accurate predictions for businesses using various analytical tools.
- Prescriptive analytics: You learn to recommend specific solutions that can propel a business in the right direction.
These four components create the entire business analytics lifecycle, from receiving data to analyzing it and drawing predictions for better decision-making.
Why Opt for Analytixlabs’s Business Analytics Course?
AnalytixLabs launched the first version of the Analytics course in Delhi NCR in 2011, pioneering Business Analytics training. Our analytics course is one of the best courses in Business Analytics and is backed by industry experts, and rated among India’s top courses since 2013.
Start your business analyst career with a premium job-oriented business analytics course in India. Get hands-on learning of all the business analytics tools – from basic statistical concepts to advanced analytics and modeling techniques. Build a promising business analytics career with skills to solve real-world problems head-on.
Our business analytics certification program will help you develop comprehensive analytics skills to drive smart business decisions, using data visualization and descriptive and predictive analytics.
Business Analytics Course – Training Modes
- Self-paced Blended eLearning: Learn through on-demand e-learning video sessions in your learning management system. You also get regular weekend interactive live case-study/ doubt sessions and additional support over mail/ online/ in-person.
- Classroom & Bootcamp: Experiential learning with in-person mentorship. It is available in weekend and weekday classroom bootcamps.
- Interactive live online: Our expert instructors lead live online sessions. Attend it from any location conveniently. Being among the best business analytics courses online, we offer fully interactive sessions for real-time discussions and questions/answers.
In addition to online training, we offer comprehensive classroom courses on Business Analytics Certifications in Bangalore and Delhi (Noida and Gurgaon). You can enroll in any of these centers for job-oriented training. As a top-rated program, our Business Analytics course provides immersive education that culminates into earning a professional certification badge. Enroll now to gain in-demand skills that will advance your career in Business Analytics.
Pre-requisites for the Business Analytics Course
This course does not require you to complete any prior coursework. Our courses are designed for beginners and professionals and cover all basic concepts to prep you up. It is all on us. All you need to do is enroll. Our experts will take it from there 🙂
Meanwhile, you can read a few resources to get started –
- Pre-requisites of a Business Analytics course
- Business intelligence vs. business analytics
- Business Analytics vs. Data Science
- Business Analytics vs. Data Analytics
- Top Puzzle Questions Asked in a Business Analyst Interview
What Will Your Career Look like after This Course?
Job market overview: According to the U.S. Bureau of Labor Statistics (BLS), job openings for business analysts are predicted to grow by 25% by 2030. Several positions that overlap with the roles of a business analyst are also predicted to see unprecedented growth in the coming years.
For instance, job opportunities for market research analysts are slated to grow by 22%, while roles like management analysts and Budget Analysts are predicted to grow by 14% and 5% by 2030.
Roles to explore:
- Analytics Consultant
- Business Analyst
- Data Analyst
- Data Science Consultant
- Data Visualization Analyst
- MIS Analyst
- Statistical Analyst
- Data Scientist
Your career path:
Role | Years of Experience | Salary Range in India [INR] |
Business Analyst | 2-4yrs | 6L-12L |
Senior Business Analyst | 2-4yrs | 9L-18L |
Business Analyst IV | 5-7yrs | 4L-18L |
Principal Business Analyst | 8+ yrs | 16L-29L |
Senior Principal BA | 8+ yrs | 18-29L |
Director, BA | 10+ yrs | 19L-29L |
Senior Director, BA | 12+ yrs | 25L-31L |
VP, Business Analytics | 12-14+ yrs | 30L-41L |
Senior VP, BA | 15+ yrs | 40L-45L |
Business Analytics Course Syllabus
The business analytics certification course syllabus has two major chunks: the core modules and elective modules (at no extra cost), offering an end-to-end learning.
Core Modules
- Foundations of Analytics and the Role of AI: You will learn the four types of analytics, the analytics project life cycle, and how AI assistants fit into analytics work. By the end, you can look at a business situation and identify the kind of analysis it calls for.
- SQL for Data Analysis (MySQL): This module covers joins, subqueries, window functions, CTEs, and AI-assisted querying. You come away able to answer a business question by writing a clean query against a live database on your own.
- Data Visualization and Dashboarding with Power BI: You will work through Power Query, DAX, interactive dashboards, and AI-assisted dashboard design. The result is the ability to build a report that answers a stakeholder’s question without a follow-up.
- Python Programming Foundations: Starting from scratch, you pick up core Python, data structures, functions, and AI-assisted coding, whether or not you have coded before. That gets you reading and writing Python confidently enough to move into real data work.
- Python for Data Analysis: Here you master NumPy, Pandas, exploratory data analysis, and visualization with Matplotlib and Seaborn. With these, you can take a raw dataset and produce a structured, visual analysis end to end.
- Applied Statistics: The focus is descriptive and inferential statistics, hypothesis testing, and the common tests analysts use most. You finish being able to back a recommendation with statistical reasoning that holds up under challenge.
Elective Modules (at no extra cost)
- Excel for Business Analysis: You will learn advanced functions, pivot tables, and dynamic dashboards. By the end, you can turn a raw workbook into a working analysis without leaving Excel.
- Predictive Modeling: This module introduces linear and logistic regression. You become capable of building a simple model that predicts an outcome and explains what drives it.
- Business Problem Solving and Communication: You will practice framing problems, defining KPIs, and data storytelling. The outcome will be the ability to take a business question and present a clear, evidence-backed answer.
- Power BI Service: Here you work through workspaces, scheduled refresh, and row-level security. With these, you can publish and manage dashboards that stay current and show each user only what they should see.
- Tableau (complimentary): A self-paced module running from core to advanced Tableau. You finish comfortably building and sharing Tableau dashboards on your own schedule.
These electives make this business analytics course syllabus go beyond the core, giving you an advanced Excel, SQL, and Power BI course experience with predictive modeling, storytelling, and enterprise dashboarding included at no additional cost.
From a functional perspective, you learn about domains such as Banking & Financial Services, Retail and e-commerce, Pharma and healthcare, and Telecom.
The curriculum is broadly divided into the following modules:
- Data Visualization and Analytics: One core skill is learning to represent your data findings through graphics. This Data Visualization and Analytics module will guide you to use common graphics like charts, infographics, plots, and animation to represent your data findings. You will learn to display complex data relationships in simplified visualizations using PowerBI/ Tableau (optional).
- Data Analytics with Python: Python plays a vital role when learning data analytics. It is easy to use and has a simple syntax and readability. It is easy to use and has a simple syntax and readability. This module will help you understand the benefits of using Python for data analytics. You will learn about Python libraries, like NumPy, Pandas, etc., for data analytics and reporting.
- Predictive Modelling and Introduction to ML: You will learn Predictive modeling techniques to predict future events or outcomes. From analyzing patterns for a given data set to predicting the most accurate outcome – you will get hands-on training in this mathematical process. Simultaneously, you will learn the basics of machine learning algorithms and libraries for data analytics and modeling with Python.
- R for Data Science (Optional eLearning): You will learn how to use R programming language in data analytics. From turning data into insights and making sense of patterns – this optional eLearning course will boost your confidence as a data analyst. R plays an important role in data handling, storing, and analysis. The benefit of learning R is that R has an environment for statistical analysis with various graphical capabilities.
Request a Call back
Orientation & Fundamentals of Analytics
Introduction to Analytics & Life Cycle of Data Analytics Projects
- What is Analytics, Data Science, and AI? – Definition
- Difference between Business Analytics, Data Analytics, Data Science vs. AI
- Types of data (Structured vs. Unstructured vs. Semi-structured)
- Understand the impact and use of data analysis based on the real-world examples
- Stages of Analytics (Introduction to types of data analysis – Descriptive vs. Diagnostic vs. Predictive vs. Prescriptive vs. Cognitive)
- Analytics Methodology & problem-solving framework (Steps to solve a Data Analysis problem.) – Life Cycle of Analytics Project
- What is AI, GenAI, Agentic AI?
- The role of AI in Data analytics
- The applications of AI in day-to-day work?
- How is AI changing the roles over time?
- Expectations from the Employers
Data Analytics with SQL(MySQL)
RDBMS - SQL
- Basic RDBMS Concepts (ERD, Data Modeling, Schema, Normalization, ETL, etc..)
- Introduction to MySQL Server
- Overview of SQL Commands (Overview of DDL, DML, DCL, DQL), SQL Syntax basics, Operators, Order of execution etc.
- Data-based objects creation (DDL Commands – Data Gathering – CRUD Operations)
- Data manipulation (DML Commands) & DQL (Data Query), Data Preparation & Analysis (Data Aggregations & Summarizations)
- Accessing data from Single & Multiple Tables using SELECT statement & Clauses, inbuilt functions
- Advanced SQL (Advanced Joins, Subqueries, Window Functions, Views, CTEs, Stored Procedures etc.)
- Integrating SQL for Analytics (Databases & Schema, Python integration)
- AI-Powered SQL & Optimization (AI-Assisted Querying and Optimization)
Visual Analytics & Dashboarding using Power BI
PowerBI
- Introduction to Data Visualization concepts, BI, Power BI
- Data Preparation and Modelling (Power Query) – Extracting data from various sources, Load Data Model – Manage Relationships
- Data Analysis Expressions (DAX)
- Reports Development (Basic & Advanced Visuals in Power BI) – Types of visuals, mapping charts with analysis, and chart formatting
- Data-Driven Story Reports
- Creation of Dashboards – Wire Frames, Slicers, Filters, Tooltips, buttons – KPI-Based Dashboarding – E-commerce Case
- Advanced / Other Power BI Concepts (Parameters, Dynamic measures, Insights presentation etc.)
- Power BI Analytics
- Publishing workbooks and Workspace
- Overview of Power BI Service
- AI-Enhanced Presentations or design of dashboard with ChatGPT/Claude
Foundations of Programming Logic
(Python Core Programming)
- Introduction to Python for Data Science
- Essentials of Python Programming (Environment, IDE’s, syntax rules, objects, indentation, comments, assignment rules, file handling, etc.)
- Data Types (numeric, string, date time, etc.) & Operators-Operands, Expressions
- Data Structures (Lists, tuples, dictionaries, sets) – Accessing Data (Indexing & Slicing)
- In-Built Functions & Methods, Packages
- Conditional, iterative, or Control Flow Statements (if, ifelse, loops, comprehensions, etc.)
- User-Defined Functions (args, kwargs), Lambda functions, Classes
- Error & Exception Handling
- File Handling
- AI-Enhanced Coding Fundamentals – AI-Assisted Coding: Pair Programming with ChatGPT
Python for Data Science
(EDA + Visualization)
- Python Packages for Data Analytics & Data Science
- Operations with NumPy (Numerical Python) – Operations
- Mastering data with Pandas
- Reading (handling diverse data formats), Auditing, Cleansing, Preparing Data with Python & packages (numpy, pandas, datetime, regex, etc.), core techniques in data wrangling (basic & advanced)
- Python-SQL integration to extract data – performing SQL codes in Python
- Data Analysis (EDA (Descriptive, Diagnostic) – statistical analysis) using Python & packages (numpy, pandas, datetime, regex, etc.)
- Data Visualization using Python & packages (matplotlib, seaborn, etc.)
- AI-assisted coding – AI-Powered Data Wrangling with PandasAI
Applied Statistics
Statistics
- Statistics Fundamentals
- Descriptive and Inferential Statistics (Measures of Central tendency, variance, deviation, frequency, symmetry, peakedness, ranking, etc…)
- Understanding data distributions (Discrete, continuous) & relationships
- Sampling & Statistical Inference
- Concept of standard error and the central limit theorem
- Concept of Confidence Intervals
- Hypothesis Testing
- Statistical Methods – Z/t-tests (One sample, independent, paired), ANOVA, Correlation, and Chi-square – Applications – Implementation in Python (scipy-stats module)
*The programme also includes additional modules designed to enhance your learning experience.
Download the brochure to view the complete course curriculum and module details.
Business Analytics Job Opportunities
- Analytics Consultant
- Business Analyst
- Data Analyst
- Data Science Consultant
- Data Visualization Analyst
- MIS Analyst
- Statistical Analyst
- Data Scientist
Job Roles
- BI Analyst
- MIS Analyst
- Data Analyst
- Data Visualization Analyst
- Business Analyst
Key Skills in Business Analytics
- Data Visualization
- Reporting Analytics
- Data Blending & Manipulation
- Detail-oriented
- Data Mining & Analysis
- MIS Reporting Analytics
- R Programming
- Visual thinker
- Statistical Analysis & Modelling
- Problem-solving skills
- Predictive Modelling
- Analytical thinking
- Python for Data Analysis
- Check your eligibility
Capstone Projects
In addition to multiple case studies used for class sessions, course includes following assignments and projects for self-study and hands-on skills.
Assignments
- 1 Assignment on basic Python
- 3 Analytics case studies using R
- 3 Basic exercises ( Excel, SQL & PowerBI)
- 10 short exercises on NumPy & Pandas
- 4 case studies on Pandas for data munging, descriptive & visual analysis
- 2 exercises for statistical analysis
Programming Tools and Languages






Projects
- Sports event analysis and reporting
- Consumer electronics pricing data analysis & visualization
- Telcom churn prediction (Classification & Machine Learning)
- Predicting credit card spend (Regression Methods)
- Peer group lending analysis & prediction (Regression Methods)
- Marketing & Sales data manipulation and analysis
- Airlines data analysis and reporting
- Sports equipment retail data analysis and visualization
- Peer group lending analysis & prediction (Regression Methods)
Who should enroll in a Business Analytics course?
- Freshers and final-year students who want a fast entry into analytics.
- Working professionals upskilling into analyst roles.
- Career switchers from non-analytics backgrounds.
- Excel, MIS, or reporting analysts moving into deeper analytics.
- Anyone who wants a shorter, affordable alternative to a long programme.
Career Opportunities to Explore
This business analytics course prepares you for a range of analytics roles, not just one. The tools and skills overlap across all of them, so you can move between paths as your interests and experience grow. Here are the opportunities worth exploring.
Analytics Consultant
Business Analyst
Data Analyst
MIS / Reporting Analyst
Business Intelligence Analyst
Marketing / Operations Analyst
Read our Business Analytics in India article for a detailed know-how on career paths, scope, salary, and growth in the Indian market.
Build a Business Analyst Career
This business analyst course prepares you for the day-to-day work of a business analyst. A business analyst spends the majority of their time pulling data to answer a question, checking whether a pattern is real, shaping the finding into a recommendation, and presenting it to people who need to act on it. That’s precisely the loop this course will train you to run.
Your Learning Path
Get the data yourself instead of waiting on another team. A baseline expectation in most business analyst job descriptions.
The fastest tool for quick analysis and modeling. Still where a large share of real analyst work happens.
Power BI and Tableau turn your analysis into something stakeholders can read at a glance and return to.
Give your recommendations weight, so you can show that a result is a real signal rather than noise.
Ties it together, since a business analyst is judged less on the analysis itself than on whether the right people understood it and acted.
From shortlisted to hired
Skills get you shortlisted, but the last stretch is getting hired. That is why this is a business analyst course with placement support, built to carry you through that stretch.
Frames your projects and skills the way hiring teams scan for, so your application reflects what you can actually do.
Puts you through realistic analyst questions, covering both the technical rounds on SQL and case-style problems and the softer rounds on how you think and communicate.
Helps you talk through your projects with confidence, explain your reasoning, and handle the follow-up questions that decide the outcome.
Analytics Consultant (entry)
Business Analyst
Data Analyst
MIS / Reporting Analyst
Business Intelligence Analyst
Marketing / Operations Analyst
Business Analytics Training Modes
Classroom & Bootcamp
An immersive, in-person learning experience designed to accelerate skill development through intensive, hands-on training and expert mentorship. It bridges the gap between theory and real-world application, equipping learners with the expertise and skills needed to succeed in today’s dynamic professional landscape.
Interactive Live Online
Blend the dynamic experience of traditional classroom with engaging, real-time interactive sessions, carefully tailored to meet the demand of busy schedules. This innovative approach ensures effective learning, fostering a deeper understanding and retention of knowledge.
Blended eLearning
Fuse the rich atmosphere of classroom instruction with the flexibility and accessibility of eLearning modules, meticulously integrated to accommodate learning preferences. This unique blend ensures an optimal learning experience, empowering participants to delve into subjects deeply.
Business Analytics Course Fees
The Business Analytics Certification Course has three learning modes. Learning experience across all modes is equally engaging and interactive in nature. Choose the one that suits you best.
Classroom Sessions
₹ 41,300/- including taxes
EMI starts @ 8,260
EMI Options
*Pay in easy EMIs starting at INR ₹6387 per month.
- Fees payable in up to 3 installments
- 0% Interest EMI – Pay in Easy Installments (though education financing partners)
- Cost-effective courses with high ROI, making it worth every penny you invest.
Interactive Live Online
₹ 37,760/- including taxes
EMI starts @ 8,260
EMI Options
*Pay in easy EMIs starting at INR ₹6387 per month.
- Fees payable in up to 3 installments
- 0% Interest EMI – Pay in Easy Installments (though education financing partners)
- Cost-effective courses with high ROI, making it worth every penny you invest.
Blended eLearning
₹ 33,040/- including taxes
EMI starts @ 8,260
EMI Options
*Pay in easy EMIs starting at INR ₹6387 per month.
- Fees payable in up to 3 installments
- 0% Interest EMI – Pay in Easy Installments (though education financing partners)
- Cost-effective courses with high ROI, making it worth every penny you invest.
Business Analytics Certification
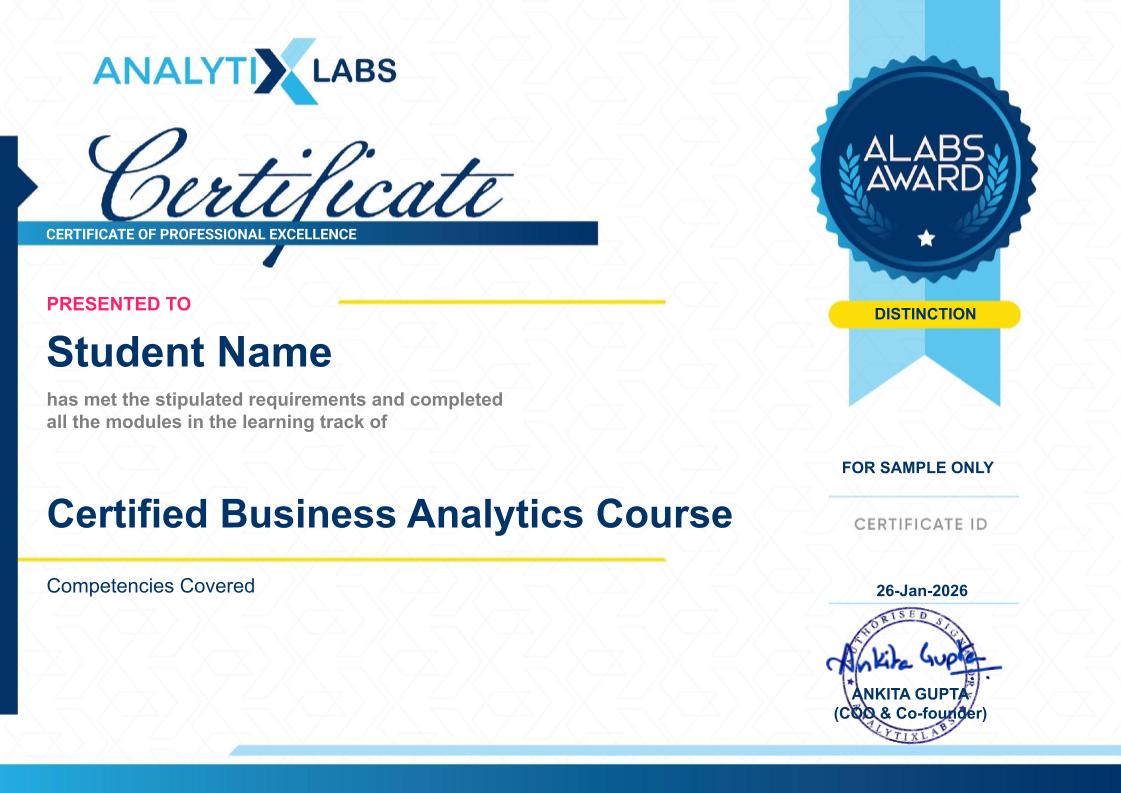
Earn a Recognized Business Analytics Certification. Finish this business analytics certification course with more than just skills and earn a dual certification from AnalytixLabs and NASSCOM-FutureSkills Prime, with every module aligned to the National Occupational Standards. This alignment adds credit to your certificate, mapping it to a recognized industry benchmark rather than an in-house badge alone.
How You Earn It
- Clear the AI-proctored assessments and a viva, scoring at least 60%.
- Get two attempts per assessment, so a single off day does not set you back.
- Complete everything within one year of registration, at a pace that fits around your work or studies.
Once earned, the certificate is yours to put to work. Add it to your LinkedIn profile and resume, where it signals to recruiters and hiring managers that your skills have been assessed against a national standard, not just self-declared.


Career Support
This business analyst training does not stop at teaching the skills. It also prepares you for the part that decides the outcome: getting through the hiring process. The support here is about readiness, helping you present what you have learned in a way that stands up in real interviews. Our placement support includes:

Resume building and profile review, so your resume and LinkedIn reflect your actual skills and projects the way hiring teams scan for them.

Mock interviews with one-to-one feedback, giving you realistic practice and specific, personal input on what to sharpen.

Interview preparation and a structured placement readiness programme that takes you through technical and case-style rounds until you can walk in prepared.
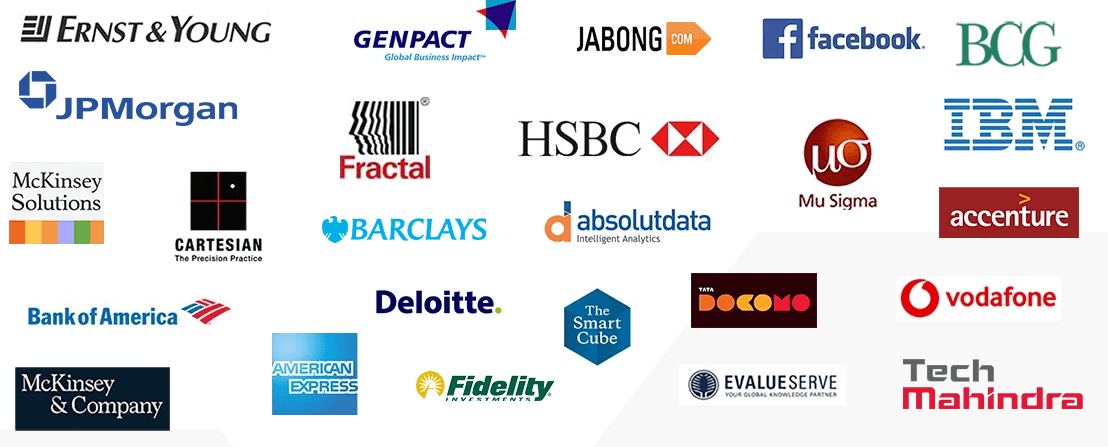
Our placement support is meant to help you explore, find, apply, prepare, and get hired in a role that excites you. We refer to recruiters as companies that have hired our alumni; they are an honest reflection of where past learners have landed, rather than a promise of placement.
How To Apply
select your course, complete the registration form, and make payment.

Submit your application
Submit your application by filling out the form, providing necessary details, and clicking submit to complete the process.

Give a selection test
Take the selection test to demonstrate your skills and knowledge. This will help us assess your readiness for the course.

Reserve your seat
Reserve your seat today to secure your spot in the course. Act fast, as spaces are limited and fill quickly!

Payment
Complete your payment to finalize your enrollment in the course. Choose your preferred payment method and follow the prompts to proceed.
What Students Say About Us?
True Stories, Transformative Career Experience
Piyush Ganar, Class of 2012 IIM Ahmedabad
(Director of Operations, Kenty.AI)
The course material is very easy to understand and the case studies were based on real time business problems. What I love the most about Sumeet and his team is that they never operated the institute like a typical commercial enterprise but more like a temple for learning. The gates of Alabs are always open for students for any kind of help and guidance. I would recommend ALabs to all.
Raajeev Kumar Sahu
(Senior Manager – Data Science, FinTech Startup)
I am from Advance Big Data Science course of Nov 2016 batch. The course was very structured and got real world problems to practice during the final case studies. It has also boosted my skills to start participating in the hackathons. Chandra sir was really helped me in preparing my resume right from very beginning of the course. Also, the placement team was very well organized and connected to industry leaders so that people get the right opportunity right after completing the course. I really recommend this institute, who are interested to transition into analytics field.
Sumit Asthana
(Assistant Manager, Senior Data Scientist)
The rapid pace at which the institutes are mushrooming all over India and Facebook newsfeed being inundated with thousands of options for analytics training, there are only handful of training institutes or rather say only couple of places where they prepare you to foray into rapidly growing analytics vertical. I have been working into legacy systems for past 5 years and was quite apprehensive if I will ever break into data science successfully.
Surbhi Sultania
(Analytics Manager, Mastercard Data & Services)
I took three months Big Data training from Analytix labs. Before joining this course, I had so many questions and doubts that will this course be worthy enough but later I found myself lucky to join this program. All trainers are amazing and always ready to help. Live examples and Case Studies are given which helps in understanding the concept and hands on practice.Not only they help in quality in depth knowledge transfer but also tend to give right direction to your career.
Vibhu Gautam
(Professor of Practice – Computer Science, UPES)
I had been associated with AnalytixLabs since 2012. This has been possible because of the mentor ship and support you get from faculty there specially from Sumeet and Chandra.I did a Business Analytic course with a focus on Marketing Analytic. The course deliver had been great and most importantly you never feel like you are part of formal classroom teaching. You are mentored there at every step, from Code Errors to Understanding Statistics behind it.
Sign up for a Free Demo Class
Benefits of Demo Account
- Get access to trial sessions to choose the most suitable course.
- SAVE UP TO 40% on specialization learning tracks.
- JOB ORIENTED COURSES crafter and delivered by industry experts.
- INDUSTRY RELEVANT programs with latest curriculum.
Want to see how it works?
Frequently Asked Questions
Q1. What is the course of Business Analytics?
A business analytics course teaches you to analyze data and use it to guide business decisions. You build skills in SQL, Power BI, Python, Excel, and statistics, and because the programme is short and job-focused, you reach employable skills faster than a long degree would take.
Q2. What are the fees and duration?
Fees range from INR 33,040 to INR 41,300/-* depending on which of the three modes you choose. The weekend programme runs four months and the weekday bootcamp runs two months, so you can pick the pace that fits your schedule. No-Cost EMI is available.
Q3. Do you get a certification?
Yes. You earn a dual certification from AnalytixLabs and NASSCOM-FutureSkills Prime. To qualify, you must clear AI-enabled assessments and a viva, which means the credential reflects assessed skills rather than mere attendance.
Q4. Does the course include placement support?
Yes. This is a business analyst course with placement support: you get resume building, mock interviews, and interview preparation through a structured placement readiness programme. The programme prepares you for the hiring process but does not guarantee a job. Our placement support sees you end-to-end: from learning the concept to exploring job roles, applying, preparing for interviews, polishing resumes, and clearing interview rounds to get the job.
Q5. Is this course suitable for beginners?
Yes. No prior coursework or coding background is needed. The course starts with foundations and builds step by step toward applied analytics, so a complete beginner can follow the full path.
Q6. Is it available in Gurgaon, Noida, Bangalore, and online?
Yes. You can attend classroom sessions in Gurugram, Noida, and Bangalore, or learn through live online and blended modes. This makes it accessible whether you want in-person teaching, including the advanced Excel course in Gurgaon, or the flexibility of learning remotely.
Q7. What tools and skills does it cover?
You will learn Excel, SQL, Power BI, Python, and Tableau, alongside applied statistics. You will also work with AI assistants to speed up everyday querying, coding, and dashboarding, so this advanced Excel, SQL, and Power BI course reflects how analysts actually work today.
Q8. Can this business analyst course help you become a business analyst?
Yes. Business analyst roles typically call for SQL, Excel, dashboards, and clear communication, and this business analyst course builds each of those. It also supports your job search through interview preparation and profile review, so you move toward the role prepared on both skills and process.
Excited?
Talk to Expert
Counselor
to gain insights into your profile and
strategize your next career move!
