AI is now part of everyday data work. We use large language models to draft copy, generate images and code, and increasingly to summarize numbers and surface trends. But a model does not know things the way you do. It learns patterns from the data it was trained on and answers by predicting what looks right, not by verifying what is true.
This is where data enters on two fronts. The data a model was trained on can be limited or biased, and the data you feed it sets the context for every answer it gives. When either is weak, the output can be confidently wrong, and that error flows straight into your report unless someone catches it.
Catching it is a skill. Reading data, questioning where it came from, and judging whether an answer holds up is what data literacy means, and AI has made it essential rather than optional. This guide covers what data literacy is, the skills and workflows behind it, where it shows up in real work, and how to build it.
What is Data Literacy?
Data literacy is the ability to understand, evaluate, analyze, and use data to make informed decisions, rather than being handed raw data with no sense of what to do with it.
In practice, it is a working skill, not a theory. When someone hands you a set of numbers, you can check where they came from, question whether they are reliable, work out what they are telling you, and turn that into a clear recommendation.
It matters for professionals in every industry: business, healthcare, education, research, finance, and technology. The tools differ, but the habit is the same. People who understand their data make better decisions, and make them faster.
Take a simple example.
You open a sales chart. A data-literate reading is not just that revenue is up. You ask what period this covers, whether the sample is large enough to trust, whether one big client is skewing the total, and what action the trend actually supports. That is data literacy in action.
Why Data Literacy Matters More in the AI Era?
As a data professional navigating the AI-needs of modern businesses, you will spend more of your day checking AI output than you expect. A large language model does not calculate the way a spreadsheet does. It predicts the most likely next words from patterns, so it can hand you a number, a chart summary, or a trend that looks right and simply is not. That failure has a name, hallucination, and it does not announce itself. A wrong answer looks exactly as confident as a right one.
That is why the judgment sits with you.
AI can process far more data than you can, but volume is not correctness, and the tool will not tell you which of its answers to trust. Deciding whether an output is reliable, accurate, or skewed is your call, not the model's.
Treat every AI output the way you would a junior analyst's first pass: useful but not final. Trace the numbers back to the source system, check the logic against what you already know is true, ask the sharper follow-up the model skipped and confirm that the data behind the answer actually supports the claim.
Once spotting bias and gaps becomes routine, you make faster calls on when to lean on AI and when to do the work yourself. Over time, you handle sensitive data more carefully as models reach into more sources.
Core Components of Data Literacy
Data literacy has several core components. Together they cover finding data, trusting it, understanding it, and acting on it.
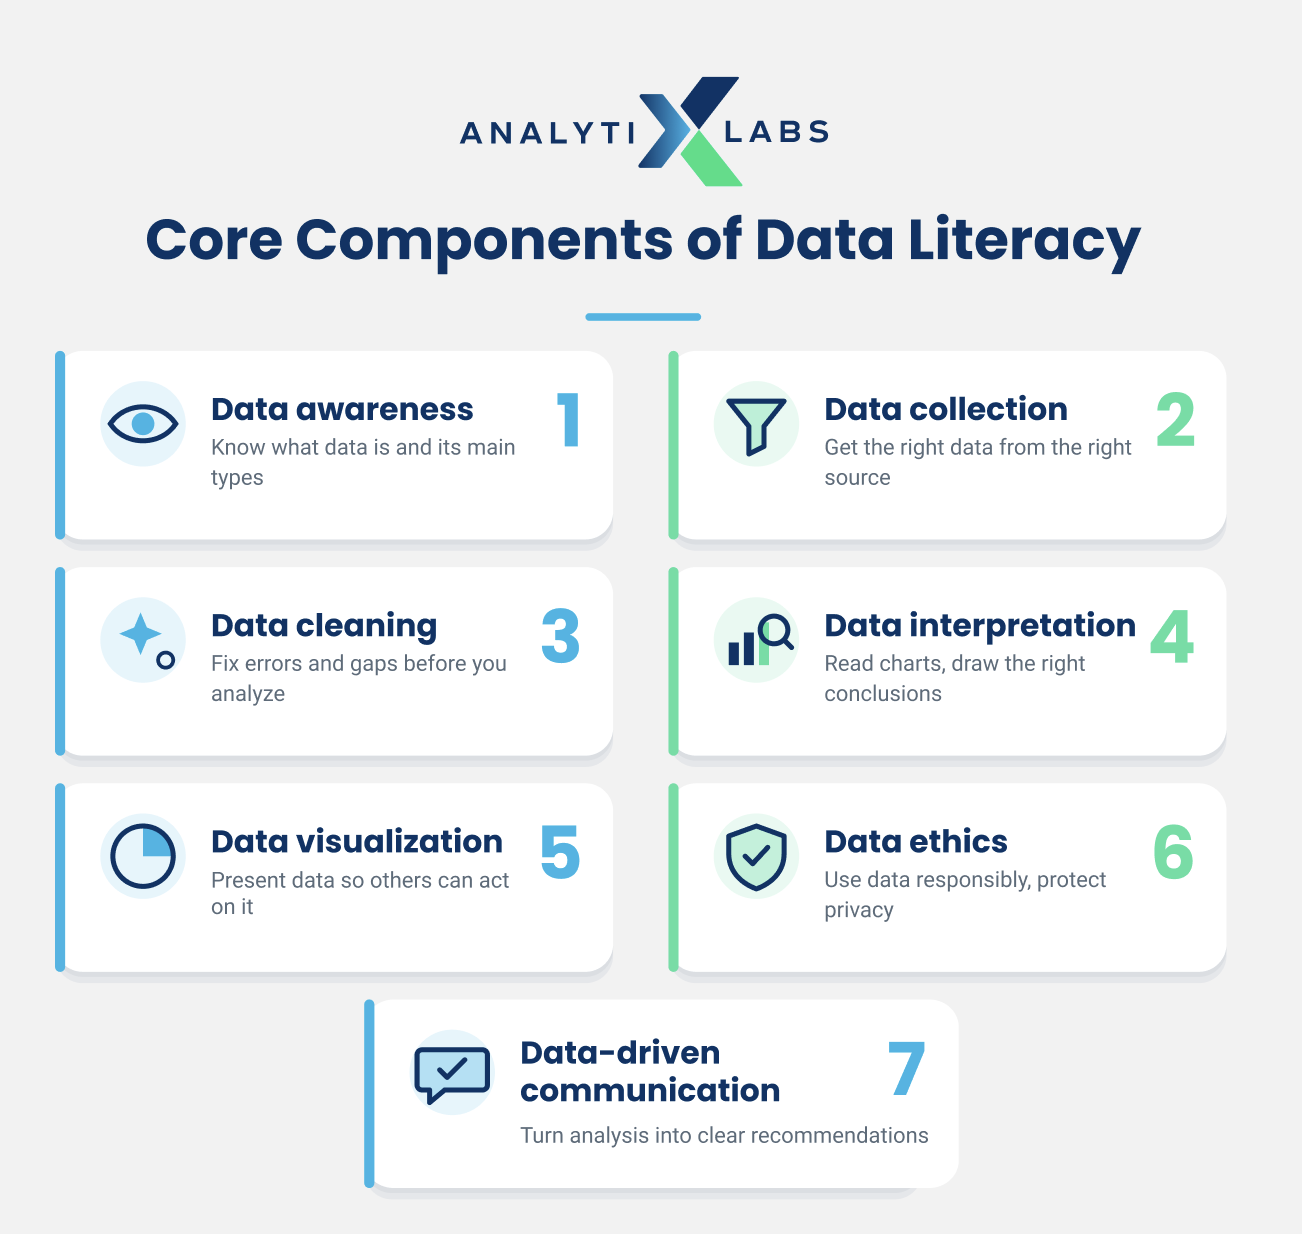
Data awareness: Understanding what data is and learning the main types. Know the difference between qualitative feedback and quantitative sales numbers, for example.
Data collection: Knowing where to look and how to get the right data. Pull a specific date range from a reporting tool rather than relying on whatever the default export gives you.
Data cleaning and quality checks: Tracking down errors and gaps in your data and fixing them so the data is usable. Remove duplicate entries before you run any analysis.
Data interpretation: Reading charts, tables, and graphs correctly and drawing the right conclusions. Remember that one strong week does not confirm a trend.
Data visualization: Presenting data so others can act on it. When presenting to non-technical audiences, choose a clear visual such as a bar chart over a dense data table.
Data ethics: Using data responsibly, respecting people's privacy, and staying within legal boundaries.
Data-driven communication: Turning analysis into clear, actionable options or recommendations that others can act on.
Levels of Data Literacy
Data literacy is not all or nothing. Most people sit at one of three working levels, and knowing yours tells you what to build next.
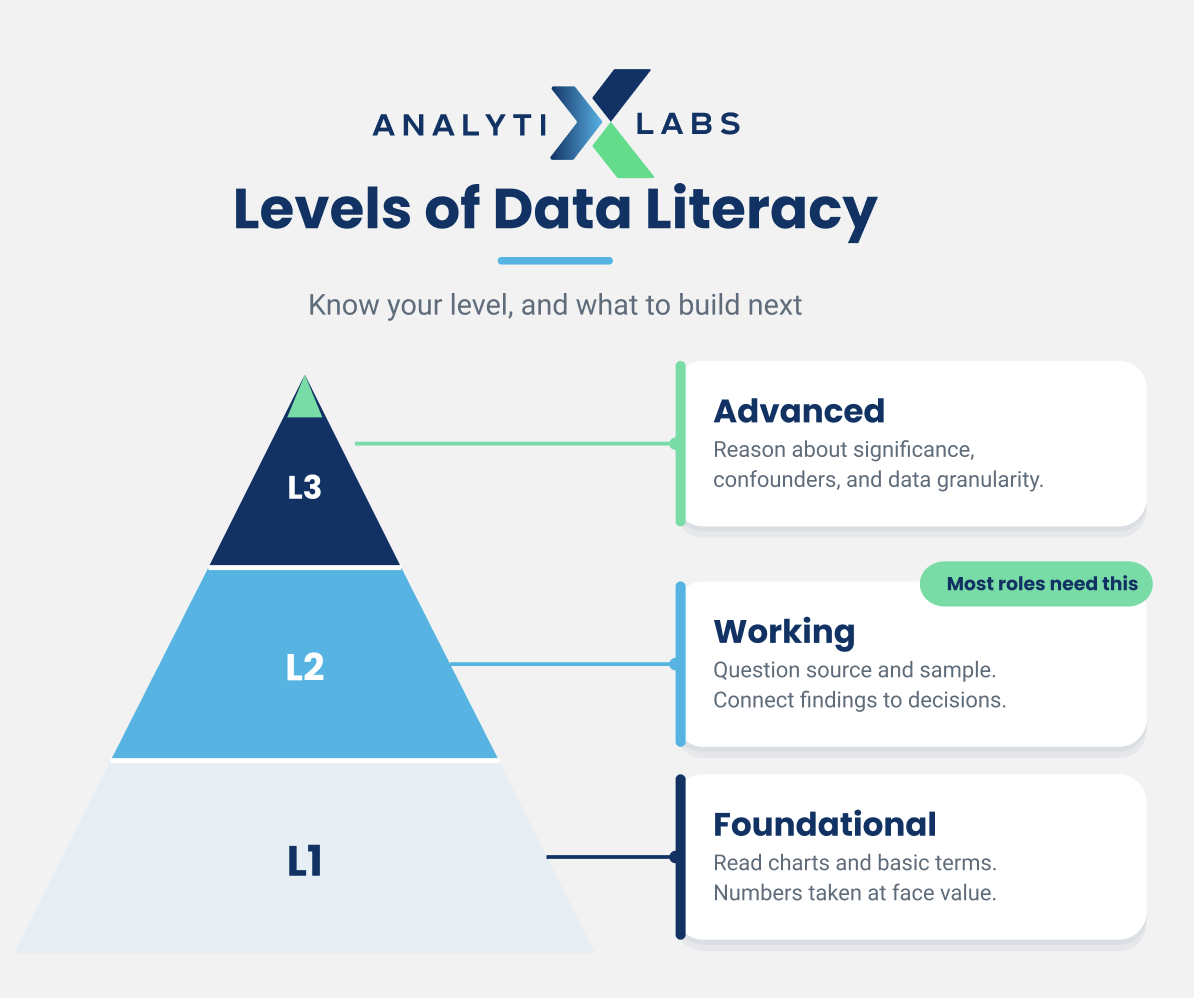
Foundational: You can read a chart, understand basic terms like average, percentage, and trend, and describe what a dashboard shows. You tend to take numbers at face value.
Working: You question the source and the sample, spot obvious errors, choose the right chart, and connect a finding to a decision. This is the level most roles actually need.
Advanced: You reason about statistical significance, confounding variables, and data granularity, design metrics that resist gaming, and know when a result is noise rather than signal.
Data Literacy Meets AI Literacy
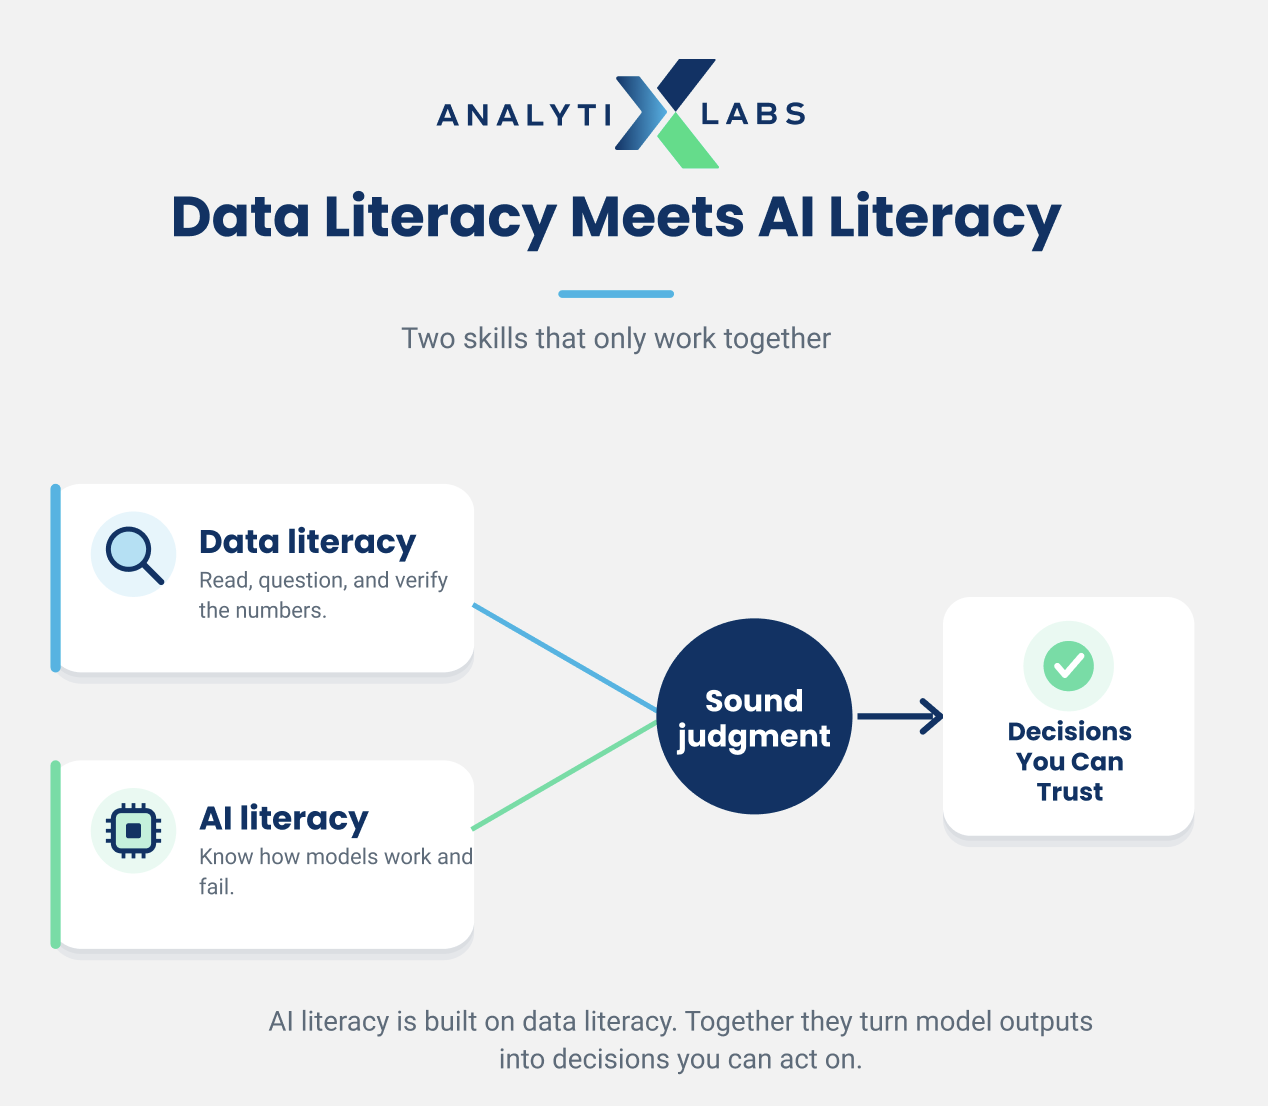
If you want to be AI literate, you have to be data literate first. The two skills sit on top of each other.
Understanding how data is collected, cleaned, and analyzed is what lets you use AI outputs for real work instead of accepting them at face value. When you know what good data looks like, you can tell when a model is doing its job and when it has gone off track.
This matters most with generative AI.
An LLM answers from patterns, not from a live calculation, so any number it produces should be checked against the source.
Techniques like retrieval augmented generation, where the model is given your own documents or data to ground its answer, reduce errors but do not remove them. You still have to judge whether the retrieved data was the right data and whether the model read it correctly. That judgment is data literacy.
AI outputs are only as good as the data behind them. An AI detector can help identify AI-generated content, but data literacy is still what tells you whether the underlying numbers and claims hold up. The two skills work together.
Here is a real example.
You ask an AI tool to summarize quarterly sales performance and the totals look off. Someone with data literacy notices the figures do not match the source system and checks whether the model pulled the wrong date range, joined a table incorrectly, or filled a gap with an invented number. Without that check, the mistake goes straight into a board report.
Data Literacy in Practice: Use Cases by Function
Data literacy is easiest to understand through the work itself. It shows up in data preparation, quality checks, predictive analysis, reporting, and visualization.
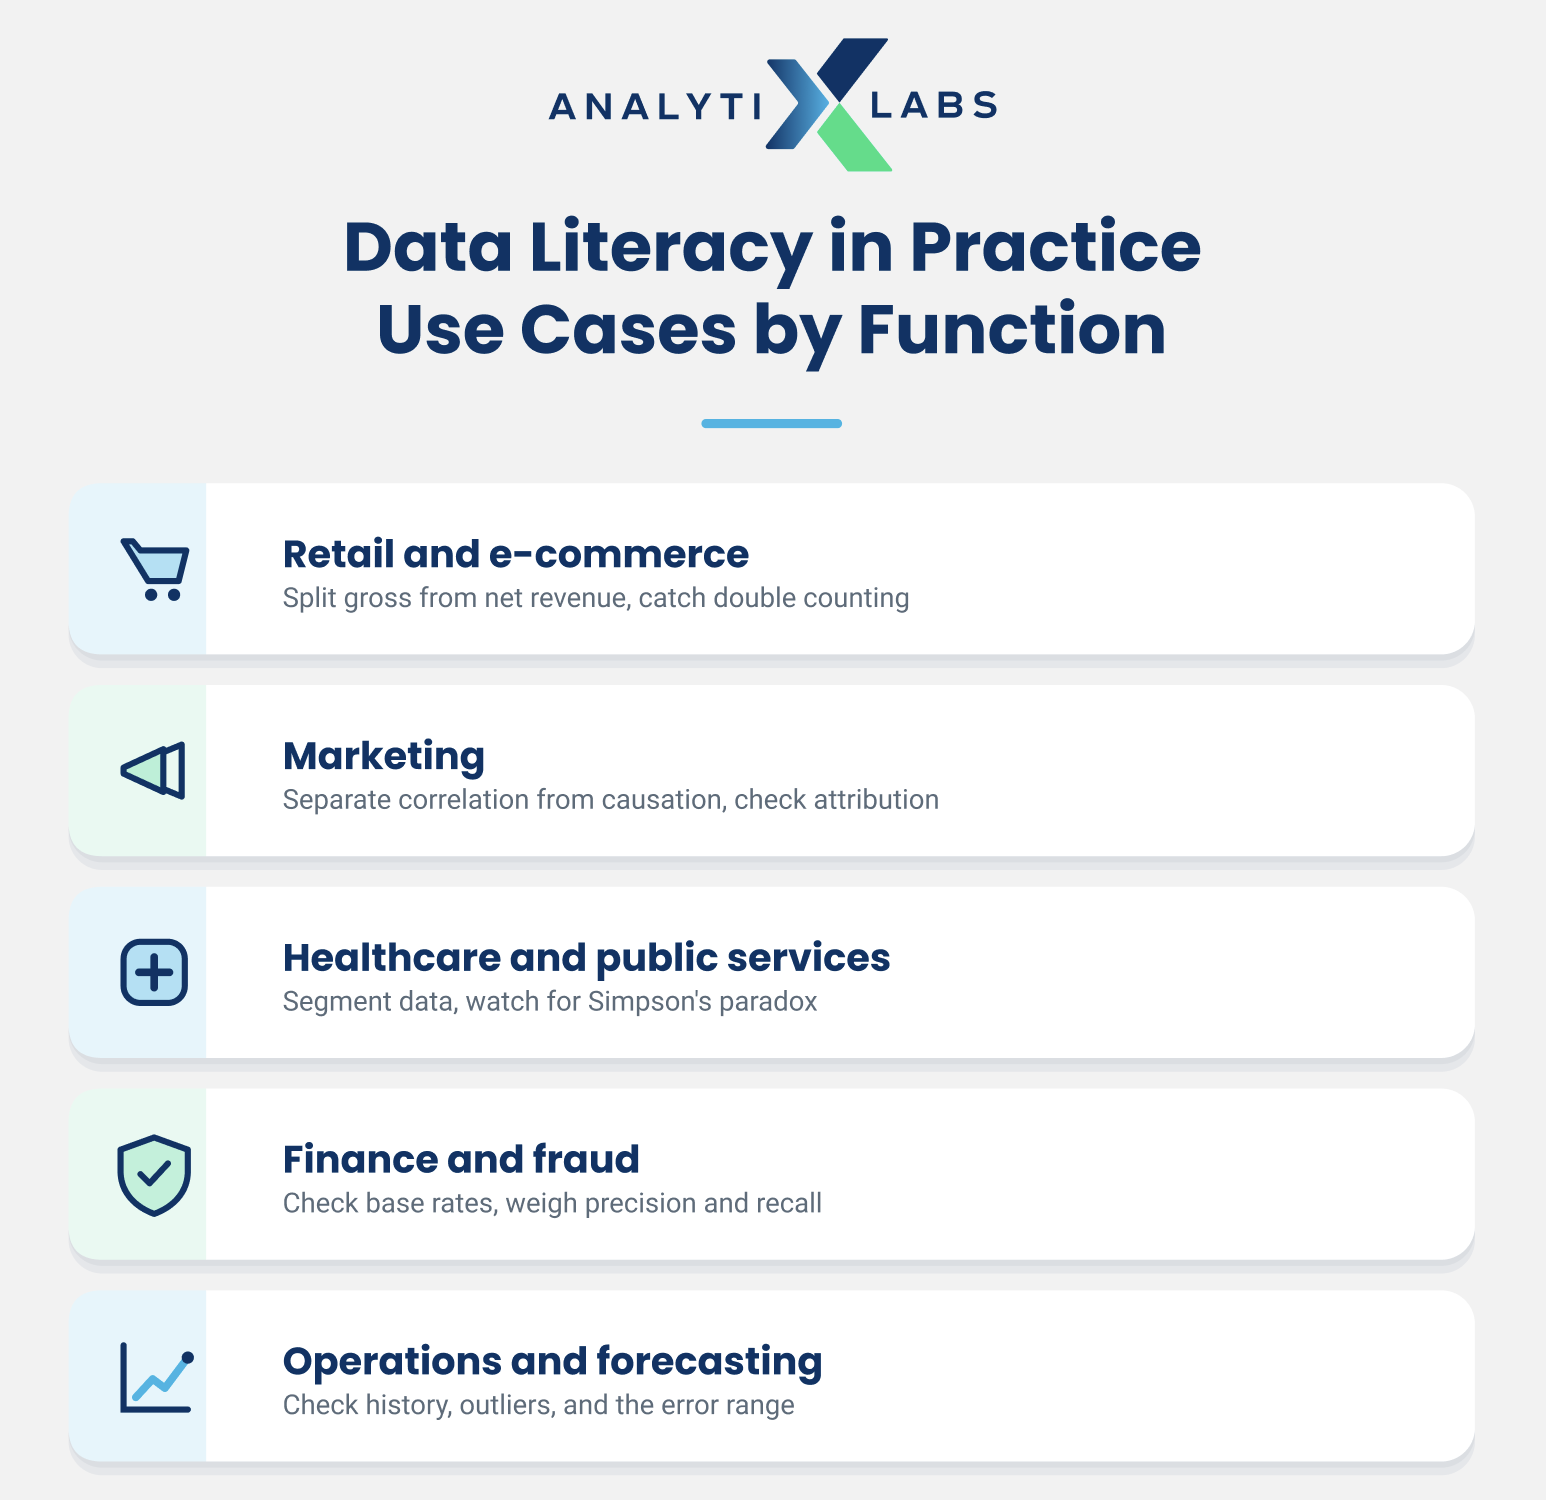
Here is how it plays out across common functions.
Retail and e-commerce. Say revenue is climbing, but returns are climbing too. A data-literate analyst separates gross from net revenue and checks the order data for double counting, which often happens when an order-line table is joined to an order table and each line multiplies the total. The headline growth may be real, or it may be a join error hiding in the pipeline.
Marketing. Ad spend and sales both rose last quarter, so spend must be working. Not necessarily. Both may be driven by seasonality or a product launch. A literate reading controls for those factors, separates correlation from causation, and looks at conversion and cost per acquisition rather than likes and impressions.
Healthcare and public services. A hospital reports that a new process cut average wait times, but reapplications went up. Averages hide the spread, so an analyst breaks the data down by case type and completeness. Sometimes an overall rate improves while every subgroup gets worse, an effect known as Simpson's paradox, which only surfaces when you segment the data.
Finance and fraud. A model flags 5,000 transactions as suspicious. Before acting, a literate analyst checks the base rate. If real fraud is rare, most of those flags will be false positives, so precision and recall matter far more than the raw count. Acting on the count alone burns customer trust and investigator time.
Operations and forecasting. A demand forecast looks confident, but a literate planner checks how much history it is built on, whether recent outliers are distorting it, and how wide the error range is. A single point estimate with no range around it is a red flag, not a plan.
Technical Habits Behind Good Judgment
Underneath those examples sit a handful of technical habits. You do not need to be a statistician, but you do need these:
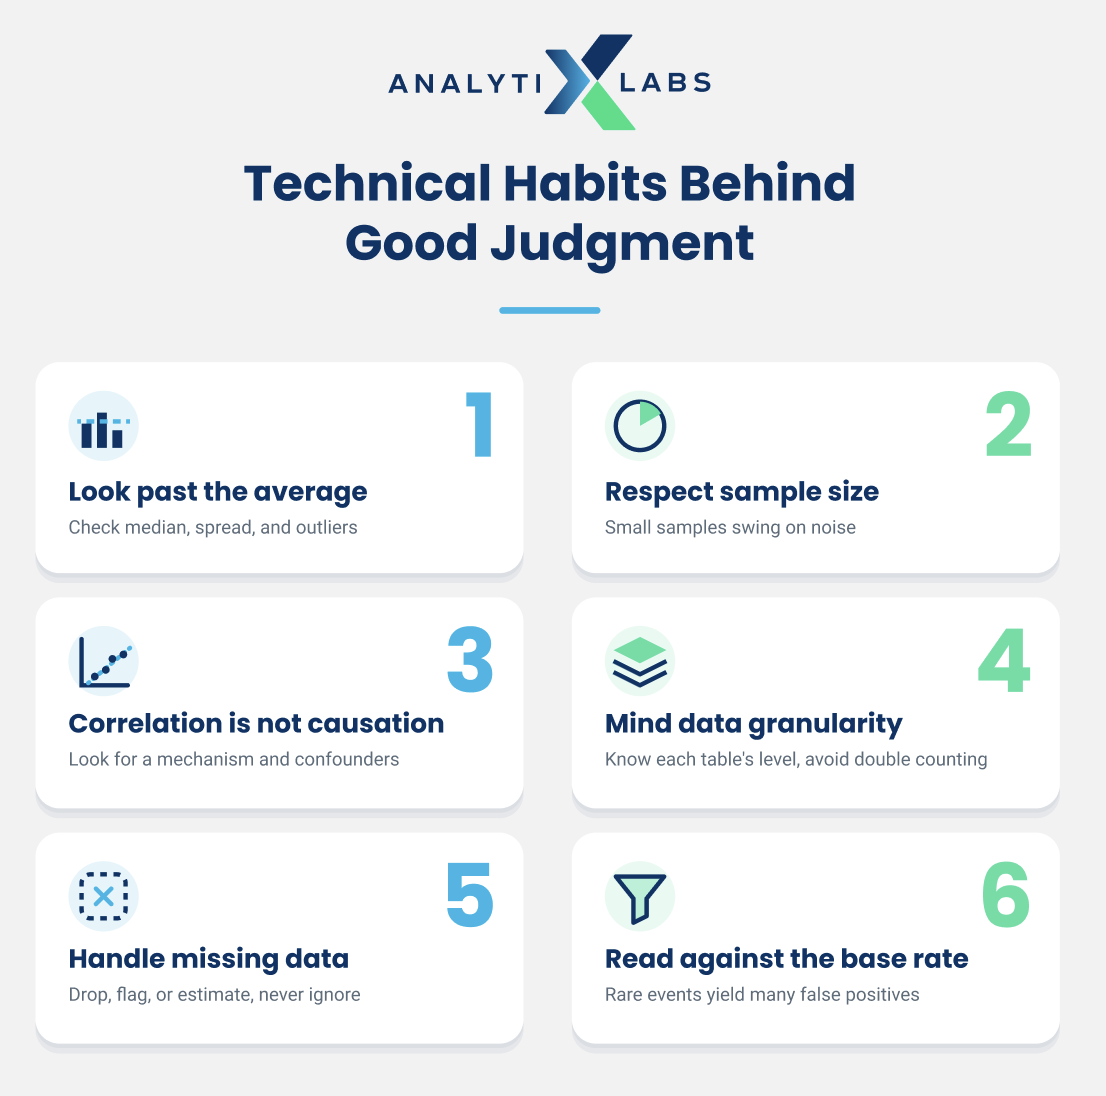
Look past the average. Averages hide the distribution. Check the median, the spread, and the outliers before you trust a single headline number.
Respect sample size. A difference between two small samples is often just noise. Ask whether the gap is bigger than normal week-to-week variation before you call it a trend.
Separate correlation from causation. Two things moving together does not mean one caused the other. Look for a plausible mechanism and for confounding variables that could explain both.
Mind data granularity. Know the level each table sits at, whether per user, per order, or per session, so that joins and aggregations do not silently double count.
Handle missing data on purpose. Decide whether values are missing at random or for a reason, and whether to drop, flag, or estimate them. Silent gaps distort every metric downstream.
Read results against the base rate. When an event is rare, even an accurate test produces many false positives. Always read a result in the context of how common the thing actually is.
Building and Future-Proofing Your Data Literacy
Any tech skill takes ongoing effort, and data literacy is no different. How you build it matters more than the hours you put in.
Consistency beats cramming. A little deliberate practice each week does more than an occasional deep session. Work with real datasets rather than tidy textbook ones, because messy data is where the skill actually lives. Reading about concepts only takes you so far.
Use tools that let you explore, clean, and make sense of data. Spreadsheets remain the fastest way to build intuition. From there, SQL for querying, Tableau or Power BI for visualization, and open sources like Gapminder or Google Trends give you room to practice. Pick one, get comfortable, then add the next.
Employers want people who can do the work, not just talk about it. In practice that means being able to:
Read charts without being misled.
Spot data that is incomplete, skewed, or misleading.
Question a number before you use it.
Think critically about what a result actually means.
Tell a clear story with data.
Work across common analytics tools.
Acting on imperfect data and connecting your analysis to a real decision are the skills that set you apart. Data literacy also spreads faster when teams work together. When analysts, managers, and technical staff review each other's work, they catch what any one person misses.
Common Pitfalls of Low Data Literacy
A few mistakes show up again and again, even with good intentions:
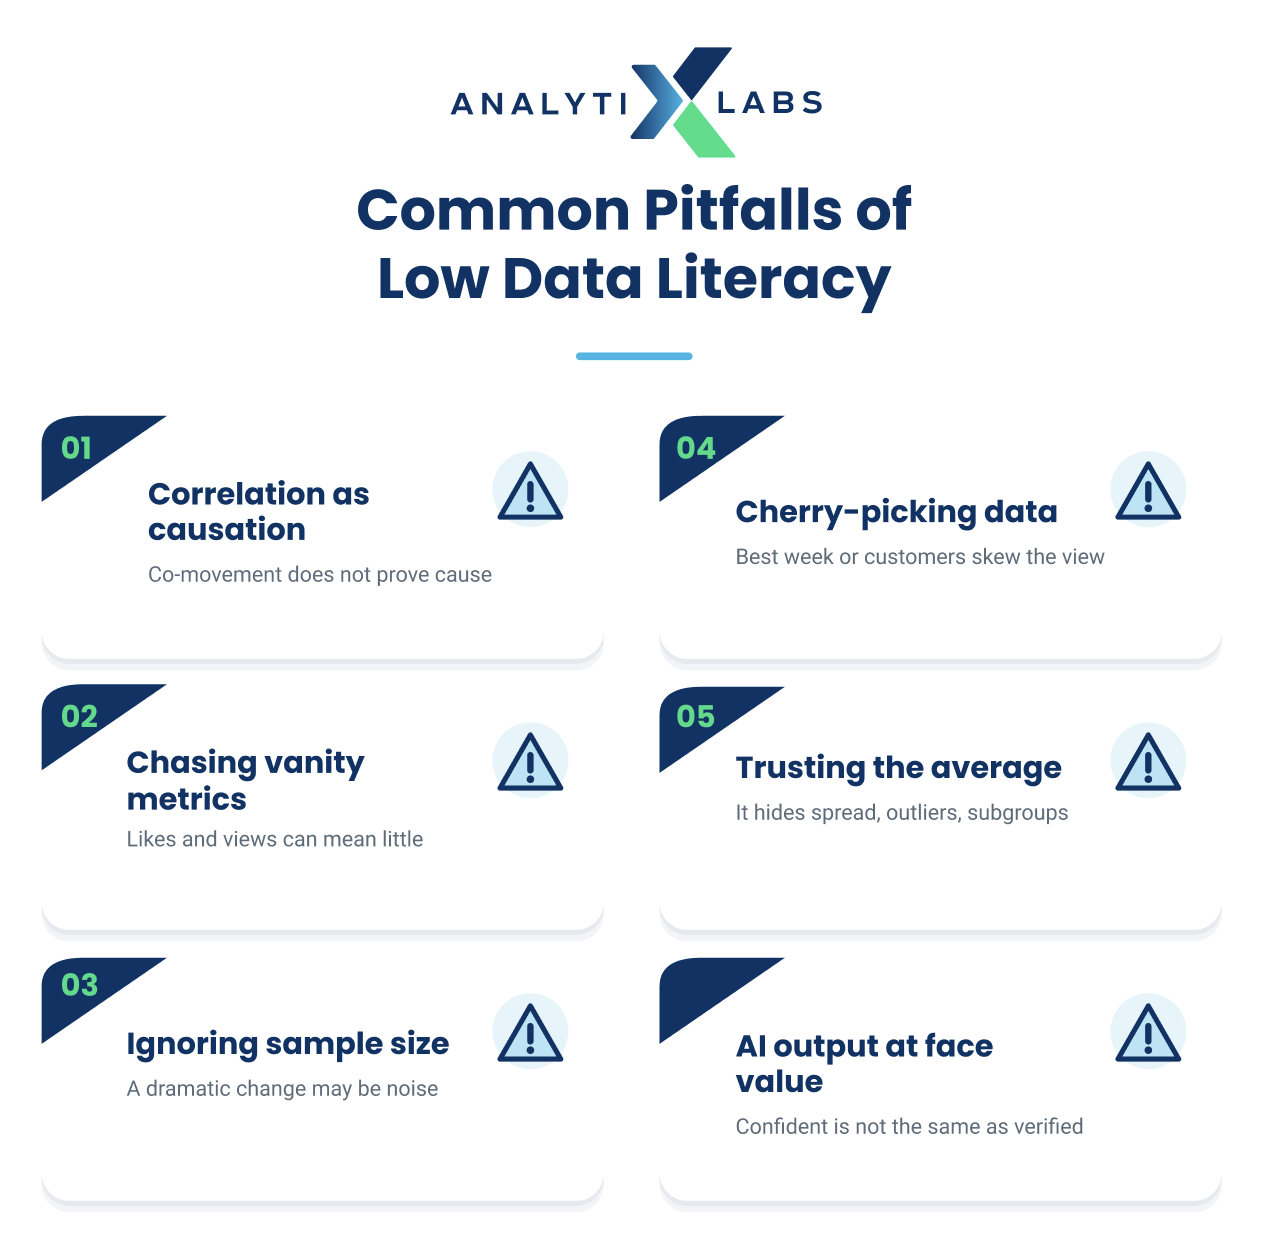
Mixing up correlation and causation. Two things moving together does not mean one caused the other.
Cherry-picking data. Looking only at your best customers or your busiest week gives a skewed picture.
Chasing vanity metrics. Likes, views, and downloads can look good without meaning much for the business.
Trusting the average. A single mean can hide a wide spread, a few outliers, or two very different groups.
Ignoring sample size. Small samples swing wildly, so a dramatic change may just be noise.
Taking AI output at face value. A confident summary is not a verified one.
Once you know what to watch for, these become far easier to avoid.
How to Assess Data Literacy on a Team?
If you manage people, you can gauge data literacy without a formal test. Give the team a real dashboard and ask three questions: what is this telling us, what would you check before trusting it, and what would you do next. Foundational readers describe the chart. Working readers question the data and connect it to an action. Advanced readers flag the assumptions and the risks. The answers show you exactly where to invest in training.
Conclusion
Data literacy has become essential because of AI. AI runs on data, so anyone using it at work needs to understand data too. As models get more capable, the risk shifts from not having answers to trusting the wrong ones, whether you are working on business analytics, forecasting, or anything else data-driven.
Build the habit of questioning where a number came from, what it leaves out, and whether it supports the decision in front of you. That habit is how you stay useful, no matter where the tools go next.
Frequently Asked Questions
What is data literacy?
Data literacy is the ability to understand, evaluate, analyze, and use data to make informed decisions, rather than being handed raw data with no sense of what to do with it.
Why is data literacy important in the AI era?
AI runs on data, but its outputs are only as trustworthy as that data, and generative models can produce confident, wrong answers. You need data literacy to judge whether a result is reliable or simply invented.
Is data literacy the same as AI literacy?
No, they are two separate but connected things. Data literacy is about understanding and working with data. AI literacy is about understanding how automated systems work, where they break down, and what the risks are. AI literacy depends on data literacy.
What are the core components of data literacy?
Data awareness, collection, cleaning and quality checks, interpretation, visualization, ethics, and data-driven communication. Together they cover finding data, trusting it, understanding it, and acting on it.
How do you measure data literacy?
Look at how someone reads a real dataset. Can they question the source, spot errors, choose the right view, and connect the finding to a decision? A quick check is to hand them a dashboard and ask what they would verify before trusting it.
What tools help build data literacy?
Start with spreadsheets, then add SQL for querying, a visualization tool like Tableau or Power BI, and open datasets from sources like Gapminder or Google Trends for practice.
How can professionals improve their data literacy?
Practice with real datasets; that is the best way to improve. Review your dashboards often and get comfortable with the analytics tools your team already uses.