 – Which One to Use?")
Principal Component Analysis (PCA) and Factor Analysis (FA) are the two most prominent dimensionality reduction techniques available. Both of these techniques help in minimizing information loss and have some similarities. Yet, they are fundamentally different.
In this article, we will understand PCA and Factor analysis, their use cases, and how to apply these techniques. We shall also look at the difference between these two methods and decide which method shall we use PCA or Factor Analysis?
Overview of Data and Dimension Reduction Techniques
Once we look around our surroundings we will find data in any form, shape, and size.
Data is an indispensable variable in our life. The text message that you received today is one form of data. The ICC cricket match score that you checked is another form of data. But these are raw and unstructured figures. These numbers and texts do not have any meaning in themselves without a context attached to them.
This context is what transforms data into information. In other words, information is structured data, having logical reasoning that makes it coherent and can drive decisions.
In our world, where we make decisions based on this structured data, there is a potential danger of having too much information and even the risk of losing some important information. Let’s look at what I mean by this.
Let’s say we are building a model to predict revenue using a simple linear regression algorithm, i.e., having only one independent variable advertising spend. With only one predictor, we will not have a reliable and accurate model; hence, we add more variables to our model, say, marketing spend, costs to procure the goods, product categories, segments.
Now, as we add more features to the model, especially when we create dummy variables for the respective categorical features, the amount of data grows exponentially. It means that the data becomes scattered and more widespread. When the dimensions increase, the volume of the features space increases such that the already available data becomes sparse. Essentially, we would not know how the data is spread across in the feature space.
This phenomenon of having too much information is referred to as the ‘Curse of Dimensionality.’ Mathematician Richard E. Bellman coined the term. The curse of dimensionality is caused by the exponential increase in volume associated with adding extra dimensions to a mathematical space.
The implication of this is that we would need more training data points to predict, which will eventually lead to overfitting of the model. This puts the model at the risk of having variance errors, meaning the model may fail to predict the new (unseen) data. This is very common in applications such as image processing.
Additionally, when we take all the variables to build the model, there is another challenge that there may be multicollinearity present. The presence of multicollinearity can also lead to overfitting as there are more insignificant variables in the data. These variables would be having a p-value of more than the 5% significance level, indicating these are not contributing to predict the revenue.
To treat multicollinearity, we can drop some of the variables, but that also comes at a cost! As each feature contains some data, some value associated with it so by removing the variables, we will lose the respective information contained in that feature.
Hence, there are powerful techniques available to deal with these challenges. These are known as Dimensionality Reduction techniques. The way forward is instead of dropping the variables, and we engineer new composite dimensions to represent the original features and replace those features.
Dimensionality reduction reduces features (from high dimensional features space to lower dimensions) to reduce the scatteredness (or sparsity) of the features space without impacting the total information content.
The two prevalent methods are Principal Component Analysis (PCA) and Factor Analysis, which help us overcome the curse of dimensionality while minimizing the loss of information.
What is Principal Component Analysis?
Principal Component Analysis (PCA) is the technique that removes dependency or redundancy in the data by dropping those features that contain the same information as given by other attributes. and the derived components are independent of each other.
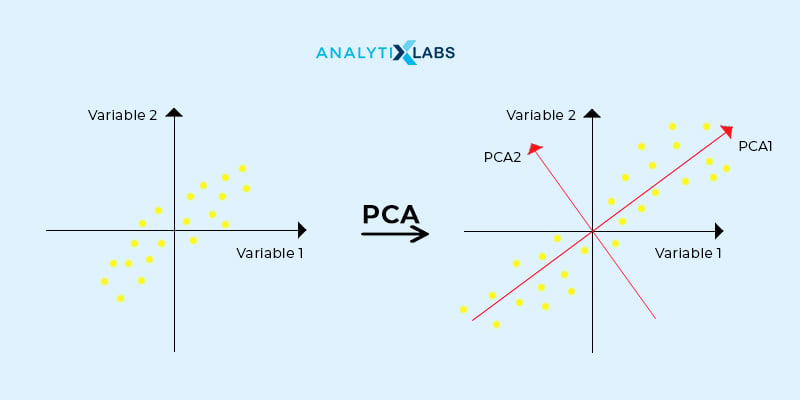
The approach of PCA to reduce the unnecessary features, which are present in the data, is by creating or deriving new dimensions (or also referred to as components). These components are a linear combination of the original variables. This way, PCA converts a larger number of correlated variables (i.e., breaks down the data) into a smaller set of uncorrelated variables. A principal component of a data set is the direction with the largest variance. Technically, PCA does this by rotation of the axes of each of the variables. The axes are rotated so that it absorbs all the information or the spread available in the variable. So, now each of the axes is a new dimension or the principal component. The component is defined as the direction of the dataset explaining the highest variance, which is implied by the eigenvalue of that component. The rotation of the axis is graphically depicted.
What is Factor Analysis?
Factor Analysis, the other technique to reduce the data, works fundamentally differently from PCA. The primary aspect of factor analysis is to unearth the latent (or also known as the factors) that store a variable’s spread (or the information).
We perform factor analysis also to decrease the larger number of attributes into a smaller set of factors. When analyzing data with many predictors, some of the features may have a common theme amongst themselves. The features that have similar meaning underneath could be influencing the target variable by sharing this causation, and hence such features are combined into a factor. Thus, a factor (or latent) is a common or underlying element with which several other variables are correlated. Also, these latent variables (or latent constructs) are not directly observable and hence are not measurable by themselves with a single variable.
For instance, the socioeconomic category is one factor. The social and economic variables, including education, employment, and education, are all correlated to each other, and this in totality influences an individual’s health. Another category of factor is the market risk that binds the returns of individual stock prices.
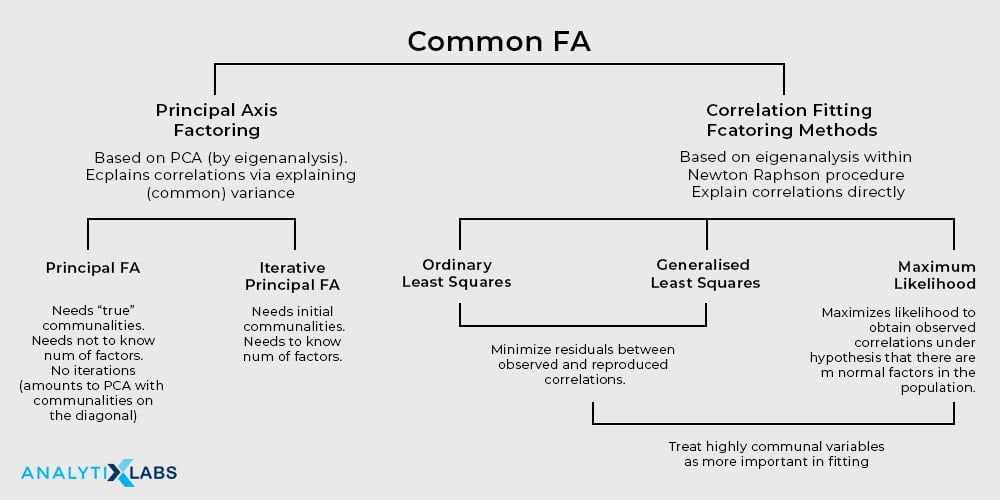
The graphic below illustrates some of the ways in which factor analysis can be conducted.
Thus, this brings us to the inevitable question: is there any difference between PCA and factor analysis? If yes, then what is it?
Difference between PCA and Factor Analysis
Well, PCA and Factor Analysis are like leopard and tiger. They both do the same job of reducing the number of variables into a smaller set by seizing the variance in the variables.
The steps involved in the process of performing PCA or FA are same:
- Standardization of the predictors
- Generation of the correlation matrix for these standardized values
- Decomposition of the correlation matrix to eigenvectors and finding their respective eigenvalues
- Rank the vectors in descending order of their eigenvalues
In PCA, the derived variables or components are equal to the number of original variables. In factor analysis, the number of defined factors is also equal to the number of original variables. Each of the components or factors extracts a certain amount of information (i.e., spread or variance) in each variable. This information content is contained in the eigenvalues. Hence, the eigenvalues express the variance that explains the information content present in that dimension or factor.
Once the components or the factors are sorted in descending order of their respective eigenvalues, we choose those components or factors that explain the significant contribution to the total eigenvalues. The components or the factors that are chosen explain the most variance as indicated by the highest eigenvalues. And, the components or factors with the lowest eigenvalues are dropped as these are insignificant and do not explain much information captured in the predictor variables.
Therefore, the course of action for both PCA and factor analysis of extracting, interpreting, rotating, and choosing the numbers of components or factors are the same. Still, the two methods have their differences. We shall look at these as explained below.
| Principal Component Analysis | Factor Analysis | |
| Meaning | A component is a derived new dimension (or variable) so that the derived variables are linearly independent of each other. | A factor (or latent) is a common or underlying element with which several other variables are correlated. |
| Purpose | PCA is used to decompose the data into a smaller number of components and therefore is a type of Singular Value Decomposition (SVD). | Factor Analysis is used to understand the underlying ‘cause’ which these factors (latent or constituents) capture much of the information of a set of variables in the dataset data. Hence, it is also known as Common Factor Analysis (CFA). |
| Assumption | PCA looks to identify the dimensions that are composites of the observed predictors. | Factor analysis explicitly presumes that the latent (or factors) exist in the given data. |
| Objective | The aim of PCA is to explain as much of the cumulative variance in the predictors (or variables) as possible. | FA focuses on explaining the covariances or the correlations between the variables. |
| How much variation is explained? | The components explain all the variance in the data. PCA captures the maximum variance in the first component, then in the second component, and henceforth followed by the other components. | The latent themselves are not directly measurable, and they do not explain all the variance in the data. Hence, it results in an error term that is unique to each measured variable. |
| Process | In PCA, the components are calculated as the linear combinations of the original variables. | In factor analysis, the original variables are defined as the linear combinations of the factors. |
| Mathematical representation | Y = W1* PC1 + W2* PC2+… + W10 * PC10 +C Where, PCs are the components and Wis are the weights for each of the components. | X1 = W1*F + e1 X2 = W2*F + e2 X3 = W3*F + e3 Where, F is the factor, Wis are the weights and eis are the error terms. The error is the variance in each X that is not explained by the factor. |
| Interpretation of the weights | The weights are the correlation between the standardized scores of the predictors (or variables) and the principal components, also known as the factor loadings. For example, in PCA, the weights indicate which component contributes more to the target variable, Y, as the independent variables are standardized. | The weights in the factor analysis express the relationship or association of each variable (X) to the underlying factor (F). These are also known as the factor loadings and can be interpreted as the standardized regression coefficients. |
| Estimation of the weights | PCA uses the correlation matrix of the variables, which generates the eigenvectors (or the components) and estimates it as the betas (or the coefficients). | The process of factor analysis ascertains the optimal weights. |
| Pecking order | In PCA, the variables are specified and then estimate the weights (coefficients or betas) through regression. | In factor analysis, the latent (or the factors) are first specified and then estimate the factor returns through regression. |
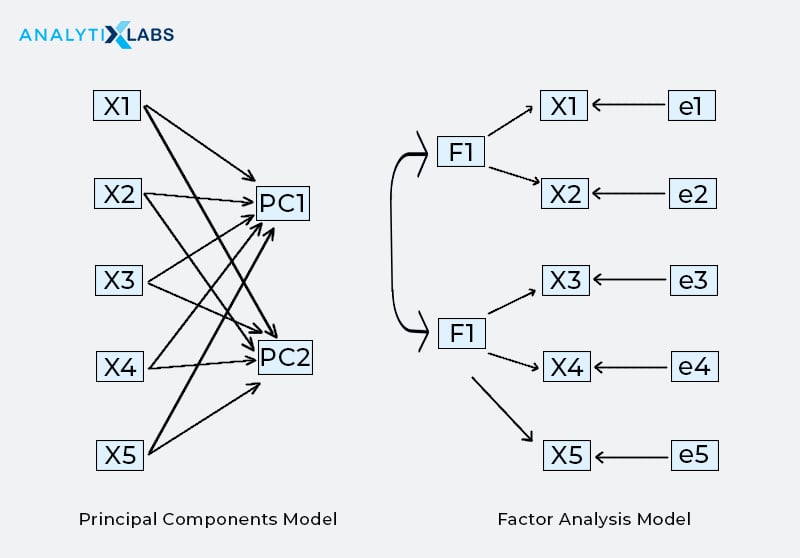
The figure below represents how the components under PCA and the factors under factor analysis looks like:
Use Cases and Applications of PCA
The use cases of PCA are:
- PCA is highly used for image processing. It has wide applications in domains such as facial recognition, computer vision. Image processing is a method to perform operations on an image to either enhance an image or extract and determine information or patterns from it.
- It has its use in the field of investment to analyze stocks and predict portfolio returns. Also, it can be used to model the yield curves.
- PCA also has its applications in the area field of bioinformatics. One such use case is the genomic study done using gene expression measurements.
- Both the banking sector and marketing have vast applications of PCA. It can be used to profile customers based on their demographics.
- PCA has been extensively used to conduct clinical studies. It is used in the healthcare sector and also by researchers in the domain of food science.
- In the field of psychology, PCA is used to understand psychological scales. It can be used to understand statically the ineffective habits that we must have broken yesterday!
Use Case and Applications of Factor Analysis
Some of the business problems where factor analysis can be applied are:
- You may have heard of the old saying, “Don’t put all your eggs in one basket.” In case you have a stock portfolio, then you know what I am referring to. Investment professionals rely on factor analysis to diversify their stocks. It is used to predict the movement across stocks in a consolidated sector or industry.
- In the space of marketing, factor analysis can be used to analyze customer engagement. It is a measure of how much a product or brand is interacting with its customers during the product’s life cycle.
- The HR managers can employ factor analysis to encourage employee effectiveness. It can be done by identifying the features that have the most impact on employee productivity.
- Factor analysis can be applied to group (or segment) the customers based on the similarity or the same characteristics of the customers. For example, in the insurance industry, the customers are categorized based on their life stage, for example, youth, married, young family, middle-age with dependents, retried. Another example is of restaurants that would frame their menu to target customers based on the demographics. For example, a fine dining restaurant in an upper locality will not have the same menu as a tea stall near a college campus.
- Schools, colleges, or universities also apply factor analysis to make their decisions as the class curriculum would be dependent on the difference in the levels of the classes. This ultimately determines the salary and staffing limits of the teachers.
- This technique is also handy for exploring the relationships in the category of socioeconomic status, dietary patterns.
- Like PCA, factor analysis can also be used to understand the psychological scales.
Which method to choose based on the problem objective?
Now, you may be wondering, which of the two techniques shall I use? PCA or factor analysis? This is an easy one.
When your purpose is to reduce the correlated observed predictors into a smaller set of dimensions or components that are independent of each other, use PCA. On the other hand, if your goal is to dig deeper to understand and test the model for the presence of latent factors that may be causing the variation in the data, then use factor analysis.
Be mindful of the fact that PCA is more appropriate to use when there is high multicollinearity present in the data where Factor Analysis sometimes fails. This is often faced while working on Classification Algorithms in Machine Learning.
Conclusion:
PCA and factor analysis are sister techniques to reduce the data from the higher dimensions to lower dimensional space without losing the information content of the data variance. Both of these have similarities yet are certainly not synonyms of each other.
Related topics you might like to read:
1. Top 40 Data Analyst Interview Questions & Answers
2. Top 45 Machine Learning Interview Questions and Answers
3. Top 60 Artificial Intelligence Interview Questions & Answers


1 Comment
Dear Neha,
Thank you for reading my message. I found something a bit weird. In the principal component model and factor analysis model (under “The figure below represents how the components under PCA and the factors under factor analysis looks like:”), it shows that the principal components are associated with each other while the factor analysis model the factors seem to be independent of each other. This contradicts the text: “components that are independent of each other, use PCA”, and “a factor (or latent) is a common or underlying element with which several other variables are correlated.”
Could you please give me some more detail on this?
Sincerely,
Siying